How Heatmap.com Generated $600,000 for a Client
Est. time: mins

Clients who understand the best ways to use the data that Heatmap.com offers have a very easy time increasing revenue for their businesses. This client used their revenue-based heatmap and scrollmap together to determine the best actions to take.
This experiment generated $600,000 in annual revenue and a 24% increase in Revenue Per Session exclusively with their Heatmap.com data.
The best part? It only took them 5 minutes!
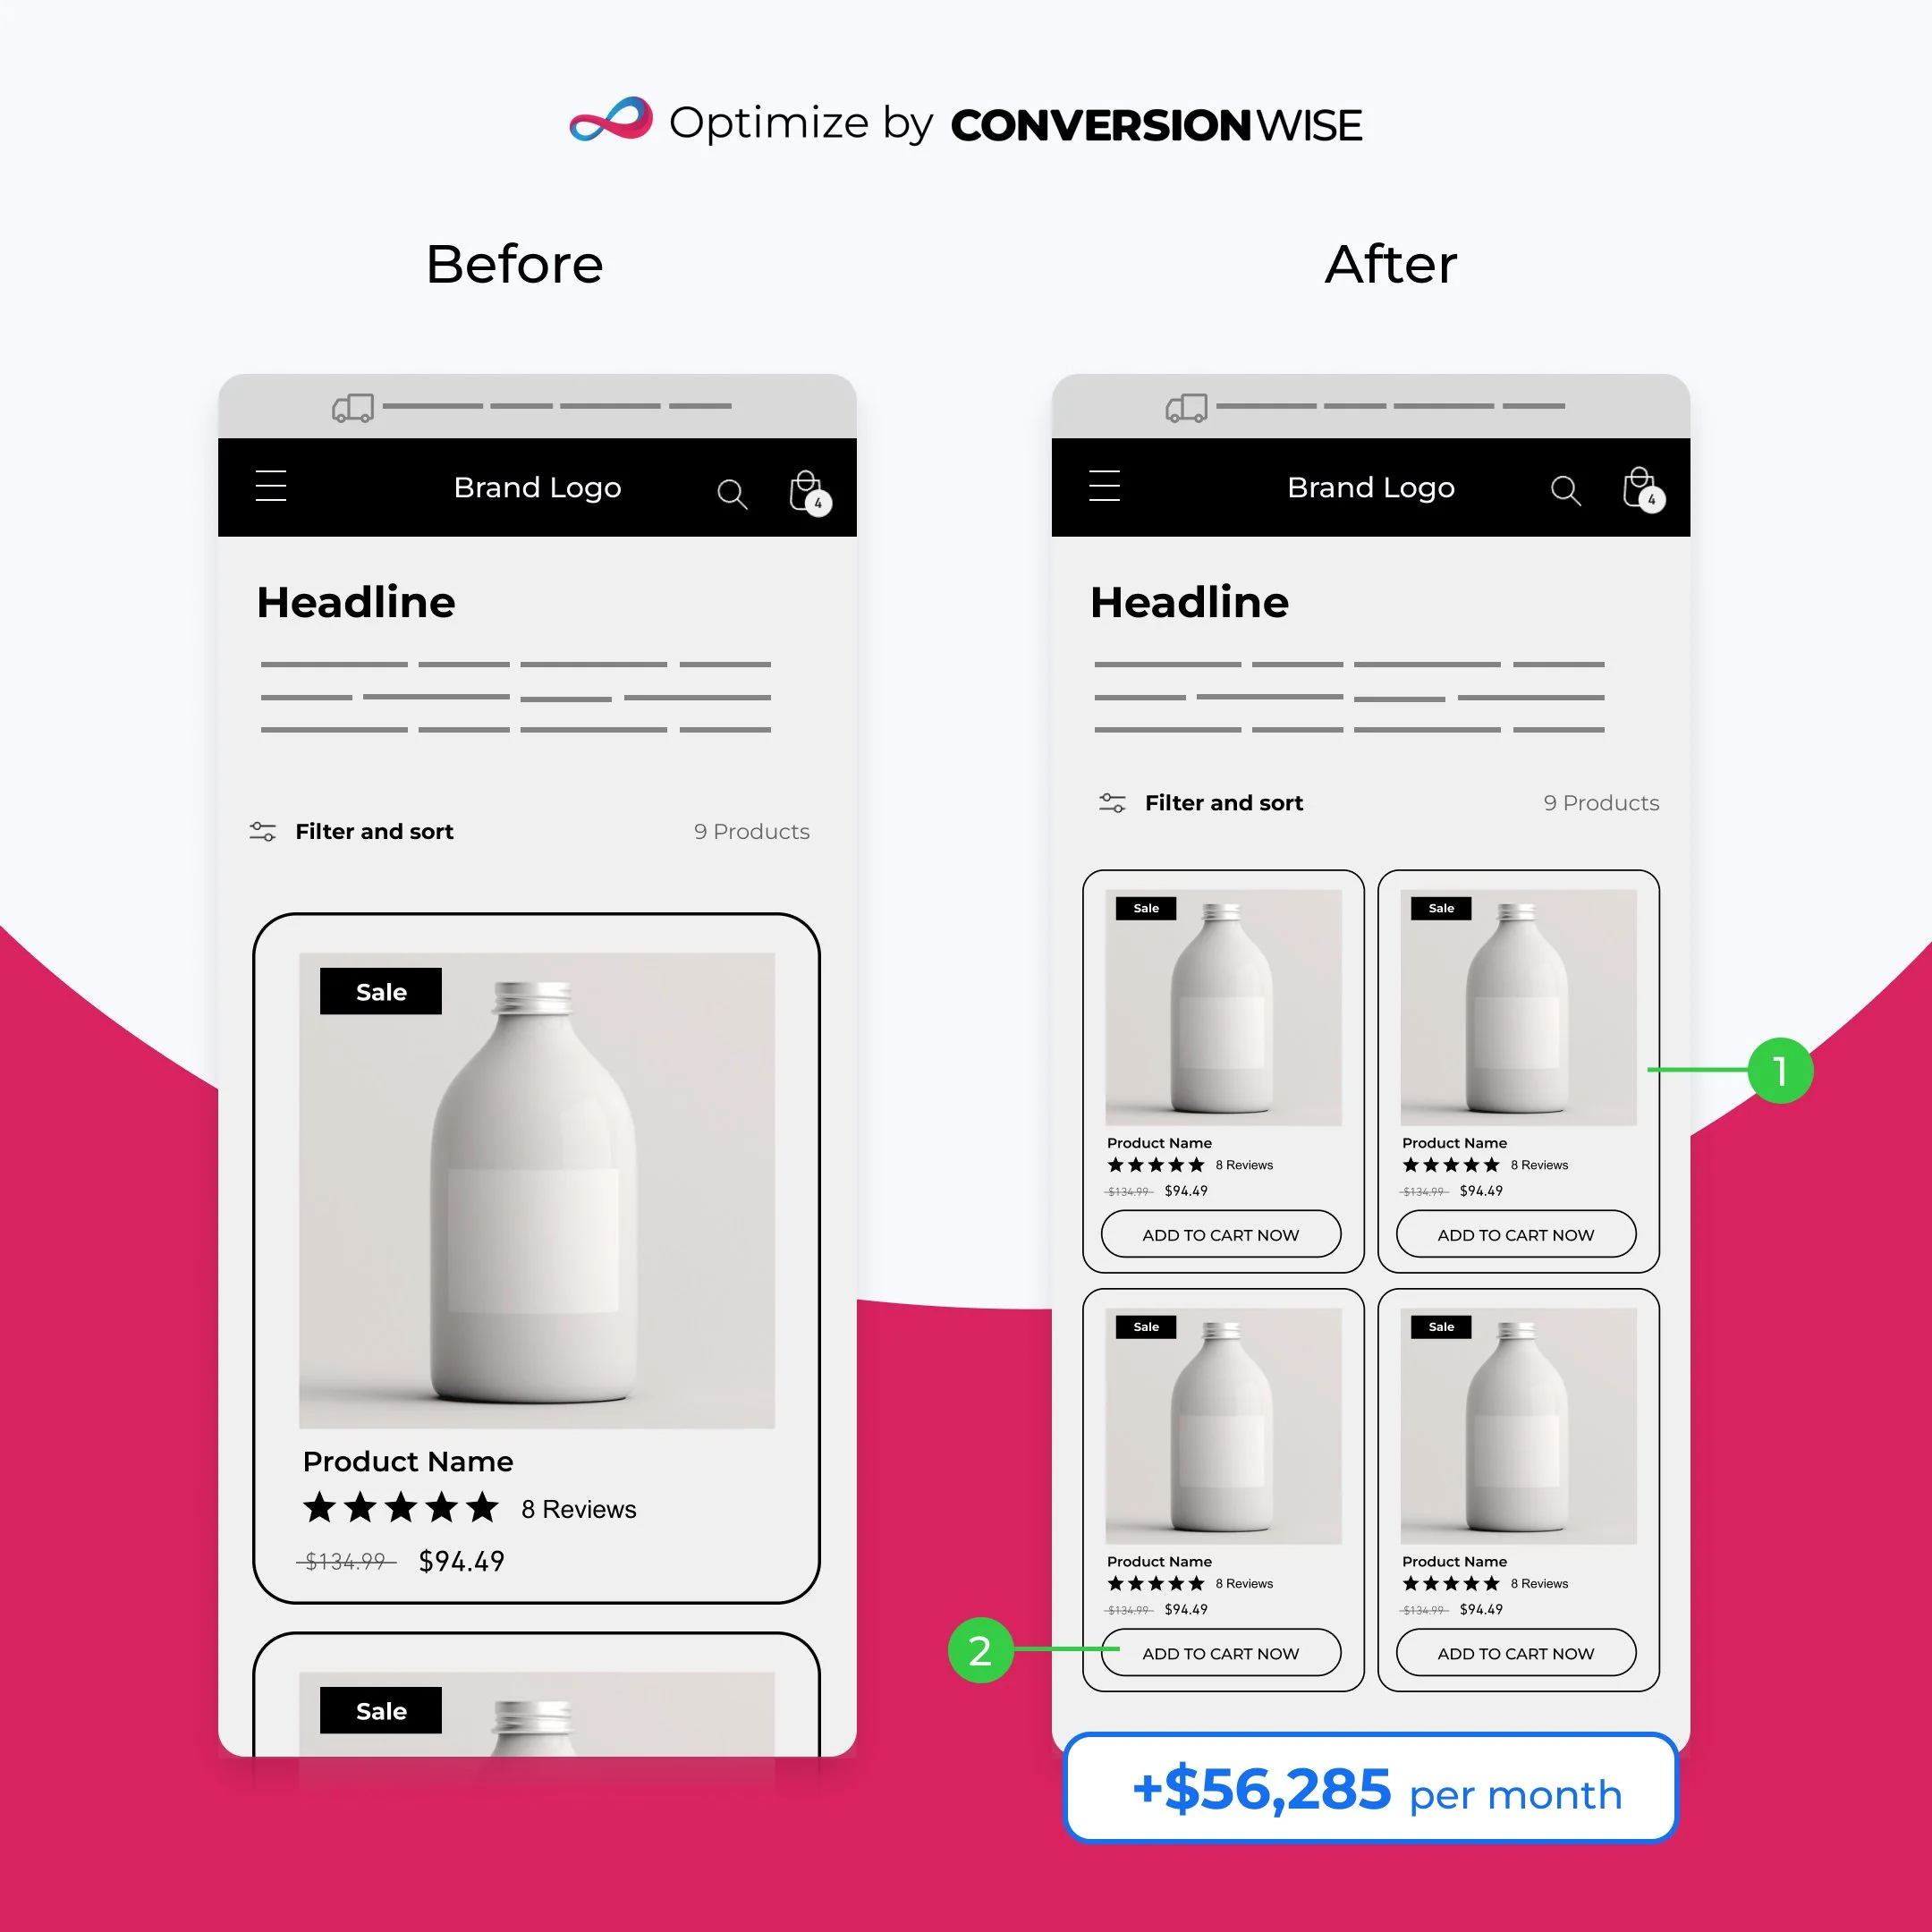
Here you can see the Before and After from the split test resulting in this large increase in performance.
The page they tested was a Collections Page for their client. Collections Pages are the pages that show many products on one page, so users can shop for any product they want.
Using our Advanced Heatmap Guide, they followed Tactic #3 for Collections Pages.
They determined the Revenue Per Session and Total Revenue generated by each product on the Collections Page, and based on the data they optimized the page in three ways:
- Removed or lowered the position of the lowest Revenue Per Session products
- Made the products in a 2 x 2 grid (two product in each row) based on scrollmap data for how many users were getting to each product.
- Added Add to Cart buttons to each product based on where users were clicking on the Product Tiles
Based on the data from your heatmap, your highest revenue-driving products will get the most visibility. Many marketers assume their “best selling products” should be at the top of their Collections Pages but case studies like this and many others from Heatmap.com show otherwise!
Also remember, every Collections Page is different. There’s typically “All Products” collections pages, but it’s important to understand that more specific Collections Pages (like Jeans or Shirts for a fashion brand) have different customer behavior than your All Products Collections Pages, so you need to optimize each one individually. This is guaranteed to give you a lift as strong as the one in the case study featured here.
How to Implement This Yourself
The following image is an example of a Collections Page showing the Revenue Per Session (RPS) of each product tile together. This is not the website from the case study, this is for your education.
The biggest rule for optimizing Collections Pages is getting the highest revenue per session products on the top of the page, where more people view the highest-converting products.

In this image, you’ll see the 4th image only has a $0.01 revenue per session, 8 times lower than the 2nd product!
This shows that although it generates a similar number of clicks, the North Star metric for optimizing these Collections Pages is Revenue Per Session.
In this example, it’s recommended to move the 4th product very far down the page because even though it’s higher on the page than other images, the RPS is still lower.
If you’re looking to get similar results for your website, start a Free Trial of Heatmap.com!