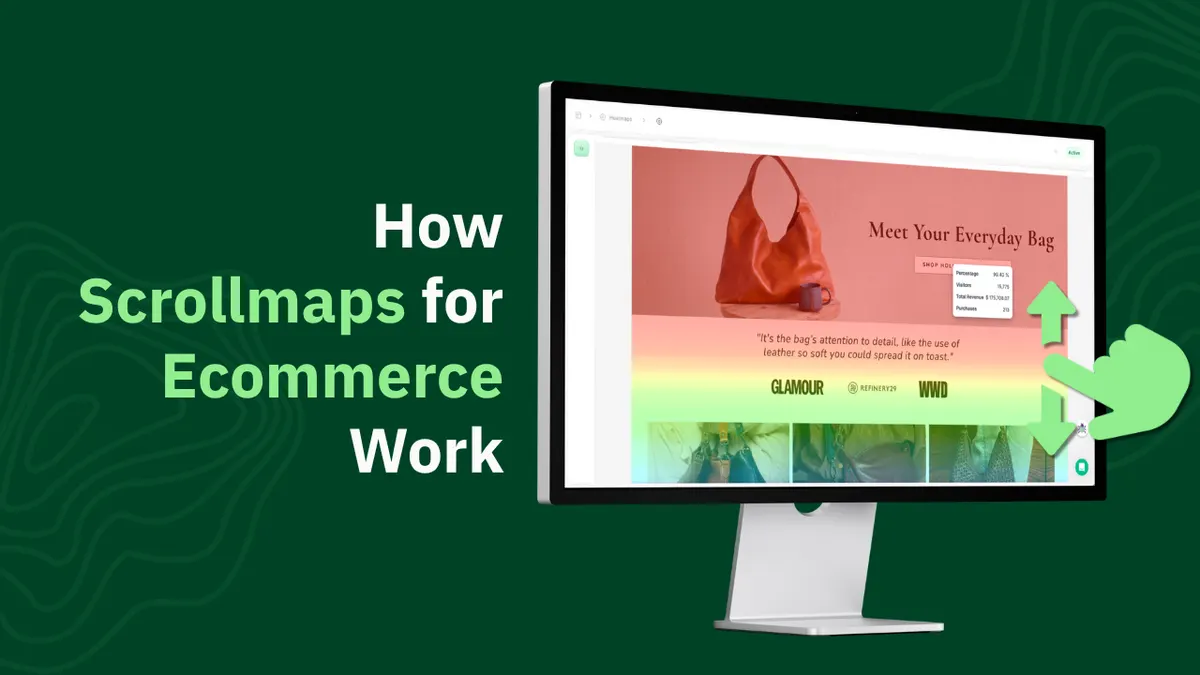
Scrollmaps are visual reports showing how far visitors scroll down your web pages. They use color gradients to indicate what percentage of visitors see different sections of your page, with warm colors (red, orange) showing high visibility and cool colors (blue, green) showing areas most visitors never reach. For ecommerce stores, scrollmaps reveal whether customers see product reviews, shipping information, or calls-to-action before leaving your site.
You spent time writing detailed product descriptions, adding customer reviews, and creating trust badges. But does anyone actually scroll down to see them? Your analytics show people visit your product pages, but they don't tell you if visitors read three sentences or everything.
Scrollmaps answer that question by showing you exactly how far down the page people scroll. You'll know that 85% of visitors see your "Add to Cart" button but only 40% scroll down to your reviews section. That tells you where to position your most important elements.
Before diving into scrollmap tools, you might want to check out related guides on clickmaps for ecommerce stores, website heatmap tools, and Shopify-specific tracking options. Now let's break down how scrollmaps work and which tools track scroll depth accurately.
What Are Scrollmaps
A scrollmap is a data visualization showing scroll depth across your web pages. Think of it as a heat gradient overlay on your page layout that shows what percentage of visitors scroll to each section.
The visualization typically works like this:
- Red or dark colors indicate 80-100% of visitors see this section
- Orange shows 60-80% visibility
- Yellow indicates 40-60% of visitors scroll this far
- Green shows 20-40% reach this point
- Blue or cool colors mean under 20% of visitors see this content
Unlike clickmaps that show where people click, scrollmaps show how deep into your content people actually go. You can see exactly where visitors stop scrolling, revealing the point where you lose their attention.
How Scrollmaps Work
Scrollmap tools install tracking code on your website that records scroll behavior. The code captures:
- How far down the page each visitor scrolls (measured in pixels or percentages)
- How long visitors spend at different scroll depths
- Which sections get the most dwell time
- Whether visitors scroll continuously or jump around
- Device type (mobile versus desktop scroll patterns differ)
This data gets aggregated across all visitors to show patterns. If 500 people visit your product page and 425 scroll past the hero image, that section shows 85% visibility on your scrollmap.
For mobile devices, scrollmaps track swipe and scroll gestures. Mobile visitors scroll differently than desktop users, so good scrollmap tools show mobile and desktop data separately.
Scrollmaps vs Clickmaps vs Heatmaps
These visualization types serve different purposes:
Scrollmaps show how far visitors scroll down pages. They answer: "What content do people actually see?"
Clickmaps show where visitors click or tap. They answer: "Which elements get interaction?"
Heatmaps can show multiple data types including clicks, mouse movement, and scroll depth. They answer broader questions about engagement.
Most analytics platforms marketed as "heatmap tools" include all three visualization types. When someone says they're using heatmaps, they typically mean they're tracking clicks, scrolls, and sometimes mouse movement together.
For ecommerce stores, scrollmaps are particularly useful because they reveal whether your most important content gets seen. You might have great product reviews at the bottom of your page, but if only 25% of visitors scroll that far, most customers never see them.
What Scrollmaps Tell You About Your Ecommerce Store
Scrollmaps reveal specific insights about how customers engage with your content:
Product Page Insights:
- Whether anyone sees your detailed product descriptions
- If customers scroll down to read reviews before buying
- How far people scroll through your product image galleries
- Whether your size charts and fit guides get attention
- If your "Recently Viewed" or "Related Products" sections ever get seen
Content Visibility Problems:
- Important trust badges positioned below where 80% of visitors stop scrolling
- Shipping information buried where only 30% of customers see it
- "Add to Cart" buttons placed too low on mobile devices
- Product specifications hidden in sections nobody reaches
Mobile vs Desktop Differences:
- Mobile visitors might stop scrolling 60% earlier than desktop users
- Vertical layouts on mobile require different content prioritization
- Desktop visitors see hero images and top content easily, while mobile users need scrolling immediately
Above the Fold Insights:
- What percentage of visitors never scroll at all (bounce at the top)
- Whether your hero image occupies too much space
- If your most important call-to-action sits above average scroll depth
- Whether mobile "above the fold" differs significantly from desktop
Review and Social Proof Placement:
- If customers actually see your review sections
- Whether testimonials positioned at page bottom get attention
- If your "As Featured In" logos ever get viewed
- Whether your FAQ sections get scrolled to
Real Scrollmap Examples for Ecommerce
Example 1: Hidden Trust Badges
An electronics store placed trust badges and security seals at the bottom of product pages. Their scrollmap showed only 32% of visitors scrolled that far. After moving badges next to the "Add to Cart" button (where 88% of visitors scrolled), their conversion rate increased 9%.
Example 2: Buried Product Reviews
A cosmetics store put customer reviews below product descriptions and ingredient lists. Scrollmaps showed 72% of visitors never reached the reviews section. Moving reviews above descriptions increased review visibility to 84% of visitors and reduced return rates by 11%.
Example 3: Mobile Scroll Drop-Off
A furniture store's scrollmap revealed 65% of mobile visitors stopped scrolling after seeing the hero image and price. Their lengthy product description never got read. They added a "Read More" accordion for descriptions and saw mobile conversions increase 14%.
Example 4: Wasted Hero Space
A clothing retailer used large hero images on collection pages. Scrollmaps showed 45% of visitors never scrolled past the hero to see actual products. Reducing hero image height by 40% moved products higher and increased click-through rates by 18%.
The 7 Best Scrollmap Tools for Ecommerce Stores
1. Heatmap: Best for Revenue-Tracked Scroll Depth
Best for: Stores wanting to connect scroll depth to revenue
Pricing: Starts at $117/month for stores with $0-$4.9M ARR
Key Features:
- Scrollmaps with revenue attribution
- Shows which scroll depths correlate with purchases
- Interactive scroll depth analysis
- AI recommendations based on scroll patterns
- Native ecommerce platform integrations
Why It's Best: Heatmap connects scroll depth to actual revenue data. You can see that visitors who scroll to your reviews section (60% scroll depth) have a 40% higher purchase rate than those who stop at product images (30% scroll depth).
The platform tracks scroll behavior through to purchase completion, showing you which content sections actually influence buying decisions versus which just create engagement.
Pros:
- Only tool showing revenue correlation with scroll depth
- Built specifically for ecommerce stores
- Separate mobile and desktop scroll tracking
- Fast installation
Cons:
- Higher price than basic scrollmap tools
- Less useful for very low traffic stores
- Requires ecommerce platform integration
Rating: 4.7/5
Free Trial: 14 days
2. Hotjar: Best Known General Tool
Best for: General websites and stores wanting scroll tracking plus other features
Pricing: Starts at $39/month
Key Features:
- Scrollmaps with percentage visualization
- Click and move maps included
- Session recordings
- On-site surveys
- Average fold tracking
Why It's Popular: Hotjar provides scrollmaps alongside clickmaps and session recordings. The "average fold" feature shows where the average screen size ends, helping you position content above or below the fold strategically.
The tool has been around long enough that you'll find tutorials and best practices from other ecommerce stores using it.
Pros:
- Includes multiple visualization types
- Large user community
- Average fold calculation
- Good documentation
Cons:
- No revenue tracking
- Generic tool not built for ecommerce
- Mobile scroll tracking less accurate
- Key features in higher tiers
Rating: 4.3/5
Free Trial: Yes, limited features
3. Microsoft Clarity: Best Free Scrollmap Tool
Best for: Budget-conscious stores testing scroll tracking
Pricing: Free forever
Key Features:
- Unlimited scrollmaps
- Click and scroll heatmaps
- Session recordings
- Clean visualization
- Fast dashboard
Why It Works: Microsoft Clarity provides scrollmap functionality for free with no traffic or session limits. The scroll depth visualization is clean and easy to understand, showing clear percentage breakdowns.
The tool combines scrollmaps with click heatmaps and session recordings, giving you multiple ways to analyze visitor behavior without paying anything.
Pros:
- Completely free
- No usage limits
- Clean scroll visualization
- Fast performance
Cons:
- No revenue tracking
- Basic reporting features
- No ecommerce-specific tools
- Manual code installation
Rating: 4.5/5
Free Trial: Not applicable (permanently free)
4. Crazy Egg: Best for Scroll Testing
Best for: Stores testing different page lengths
Pricing: Starts at $29/month
Key Features:
- Scrollmaps with confetti overlay
- Built-in A/B testing
- Snapshots for comparison
- Clickmaps included
- Session recordings
Why Consider It: Crazy Egg's confetti overlay shows individual scroll depths as colored lines, letting you see distribution patterns. Combined with A/B testing, you can test shorter versus longer page layouts and immediately see scroll depth differences.
The snapshots feature saves scroll data before and after content changes, making it easy to compare engagement across different page versions.
Pros:
- A/B testing included
- Confetti view shows distribution
- Snapshot comparisons
- Affordable pricing
Cons:
- No revenue tracking
- Older interface design
- Limited recordings on base plan
- No ecommerce-specific features
Rating: 4.4/5
Free Trial: 30 days
5. Mouseflow: Best for Detailed Scroll Analysis
Best for: Stores needing advanced scroll filtering
Pricing: Starts at $39/month
Key Features:
- Scrollmaps with attention tracking
- Shows time spent at each scroll depth
- Friction scoring for problem areas
- Form analytics
- Geographic scroll data
Why It Helps: Mouseflow tracks not just how far people scroll but how long they spend at each depth. You can see that visitors spend 8 seconds at your product description but only 2 seconds on your specifications, revealing which content actually gets read.
The friction scoring identifies sections where visitors scroll back and forth repeatedly, indicating confusion or missing information.
Pros:
- Time-at-depth tracking
- Friction scoring
- Detailed filtering options
- Geographic data
Cons:
- No revenue attribution
- Session limits on lower tiers
- Interface looks dated
- Basic ecommerce features
Rating: 4.6/5
Free Trial: 14 days
6. Lucky Orange: Best Budget Option
Best for: Small stores needing basic scroll tracking
Pricing: Starts at $10/month
Key Features:
- Real-time scrollmaps
- Live chat integration
- Dynamic scroll visualization
- Session recordings
- Conversion funnels
Why Stores Use It: Lucky Orange costs $10/month and includes scrollmaps with live chat. For small stores, you get scroll depth tracking and customer chat for less than most standalone scrollmap tools charge.
The real-time scroll visualization shows current visitor scroll positions as they happen, useful for watching how people interact with new page layouts immediately.
Pros:
- Very affordable
- Live chat included
- Real-time scroll viewing
- Good for small stores
Cons:
- Session limits fill quickly
- No revenue tracking
- Basic scroll features
- Limited filtering
Rating: 4.3/5
Free Trial: 7 days
7. Smartlook: Best for Mobile Scroll Tracking
Best for: Stores focused on mobile optimization
Pricing: Starts at $55/month
Key Features:
- Mobile-optimized scrollmaps
- Cross-platform tracking
- Automatic event recording
- Session recordings
- Mobile app scroll tracking
Why Consider It: Smartlook excels at tracking mobile scroll behavior, important for ecommerce stores where 70-80% of traffic comes from mobile devices. The tool handles touch-based scrolling and swipe gestures accurately.
If you have both a website and mobile shopping app, Smartlook tracks scroll behavior across both platforms from one dashboard.
Pros:
- Excellent mobile tracking
- Cross-platform support
- Automatic event tracking
- 30-day trial
Cons:
- More expensive than alternatives
- Some recording bugs reported
- No revenue tracking
- Price increases with traffic
Rating: 4.6/5
Free Trial: 30 days
Quick Comparison Table
| Tool | Best For | Starting Price | Revenue Tracking | Mobile Scrollmaps | Rating |
|---|---|---|---|---|---|
| Heatmap | Revenue attribution | $117/month | ✅ Yes | 🌟 Excellent | 4.7/5 |
| Hotjar | General use | $39/month | ❌ No | 👍 Good | 4.3/5 |
| Microsoft Clarity | Free option | Free | ❌ No | 👍 Good | 4.5/5 |
| Crazy Egg | A/B testing | $29/month | ❌ No | 👍 Good | 4.4/5 |
| Mouseflow | Detailed analysis | $39/month | ❌ No | 👍 Good | 4.6/5 |
| Lucky Orange | Budget option | $10/month | ❌ No | ⚪ Basic | 4.3/5 |
| Smartlook | Mobile optimization | $55/month | ❌ No | 🌟 Excellent | 4.6/5 |
How to Use Scrollmaps to Improve Your Store
Step 1: Install a scrollmap tool and collect data for at least two weeks. You need enough visitors to identify patterns. Weekend scroll behavior often differs from weekday patterns.
Step 2: Check your highest-traffic pages first. Product pages, collection pages, homepage. These generate the most data and impact conversions most.
Step 3: Look at mobile and desktop separately. Mobile visitors scroll differently and see less content per screen. Your desktop layout might work great while your mobile layout fails.
Step 4: Identify your average scroll depth. If 70% of visitors stop scrolling at 50% of page length, everything below that point needs to move higher or gets ignored.
Step 5: Find your most important content in scrollmaps. Where are your product reviews? Trust badges? Detailed specifications? If they're below average scroll depth, most visitors never see them.
Step 6: Test moving critical elements higher. Move reviews, trust badges, or key product details above your average scroll stopping point. Wait two weeks and check if conversions improve.
Step 7: Reduce above-the-fold waste. If your hero image takes up so much space that 40% of visitors never scroll past it, you're wasting prime real estate on something that doesn't drive purchases.
Step 8: Focus on scroll sections that correlate with revenue. If your scrollmap tool tracks revenue (like Heatmap does), prioritize optimizing sections where deeper scrolling correlates with higher purchase rates.
Common Questions About Scrollmaps
What's a good average scroll depth for ecommerce product pages?
Most ecommerce product pages see 60-70% average scroll depth. If your average is below 50%, you might have too much content, large images pushing important elements down, or boring content people don't want to read.
Do scrollmaps work on mobile devices?
Yes. Good scrollmap tools track touch-based scrolling and swipe gestures on mobile. Mobile scrollmaps look different than desktop because mobile screens show less content at once, requiring more scrolling to see the same information.
How many visitors do I need before scrollmap data is reliable?
At least 500-1000 visitors per page for meaningful patterns. Below that, individual behavior can skew averages. Low-traffic stores should collect data for a month before making decisions.
What does it mean if nobody scrolls past my hero image?
Either your hero image is too large (pushing content too far down), your content isn't compelling enough to make people want to scroll, or your page loads slowly and visitors leave before content appears.
Should product pages be shorter or longer?
Depends on your product. Complex products (electronics, furniture) need detailed descriptions and specifications. Simple products (t-shirts, phone cases) need less. Use scrollmaps to see if people actually read long descriptions or ignore them.
Can I track scroll depth on specific user segments?
Advanced tools like Heatmap and Mouseflow allow segmentation by visitor type, traffic source, or device. Basic tools show aggregate scroll data for all visitors combined.
Do scrollmaps show how fast people scroll?
Some tools track scroll speed and time spent at different depths. Mouseflow specifically shows how long visitors spend at each section, revealing which content gets read versus skimmed.
What's the fold and why does it matter?
The fold is the bottom of the screen before scrolling. Content "above the fold" is visible immediately. Content "below the fold" requires scrolling to see. Scrollmaps show your actual average fold across different screen sizes.
How often should I check scrollmaps?
Check monthly for established stores, weekly after major design changes. Scrollmaps don't change dramatically day-to-day unless you modify page layouts or content structure.
Can scrollmaps help reduce bounce rate?
Yes. If scrollmaps show high bounce with minimal scrolling, your above-the-fold content isn't engaging enough to make people want to see more. Improving that content should reduce bounces.
Ready to Track Scroll Depth and Revenue
Most scrollmap tools show you how far visitors scroll. Only Heatmap connects scroll depth to revenue, showing you which content sections actually influence purchases versus which just create engagement. Ready to see which content drives sales? Use Heatmap and connect your scroll data to your bottom line.

Dylan AnderPublished December 1, 2025