Another BFCM in the books!
Key Stats from BFCM 2025 (Thursday-Monday)
- 377.9M page views
- 62.7M sessions
- 474M events (clicks)
- 4.0M conversions
- $504.7M in total revenue
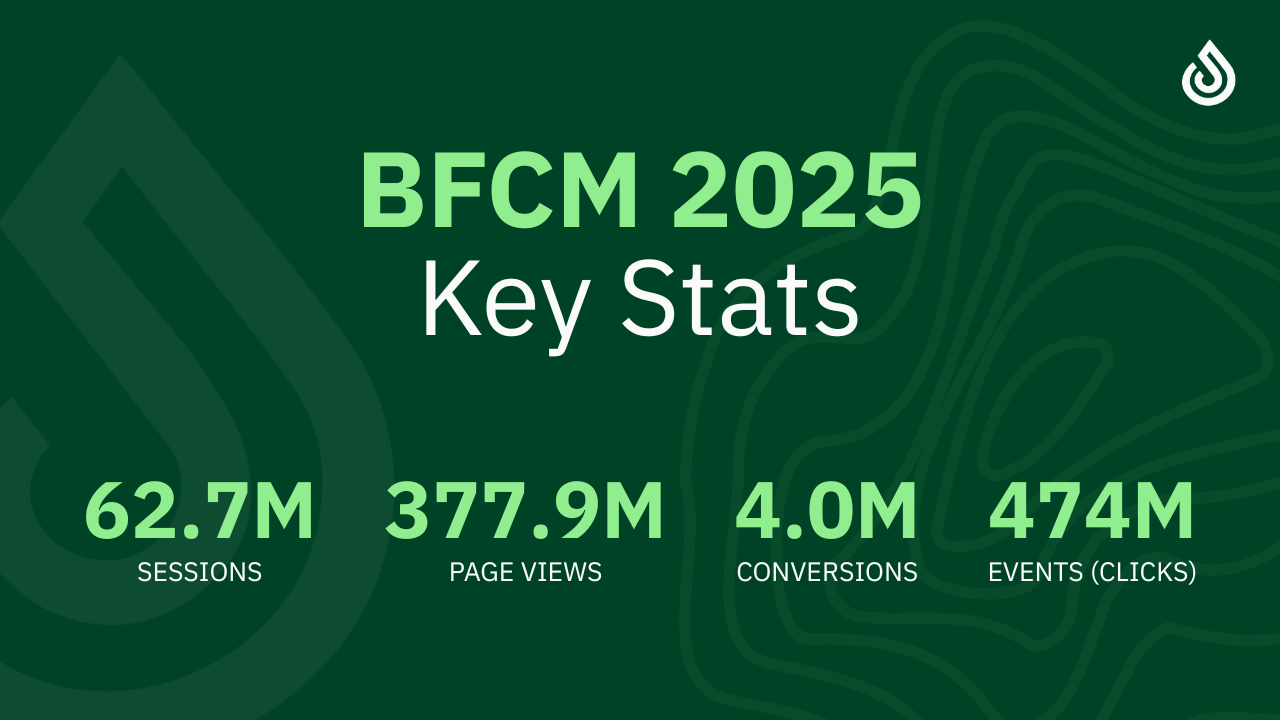
These numbers represent data from ecommerce sites using heatmap during the biggest shopping weekend of the year. The patterns we observed reveal critical insights about shopper behavior that can help you optimize for future peak shopping periods. Let's dive in!
Traffic Distribution: Where Shoppers Are Spending Their Time
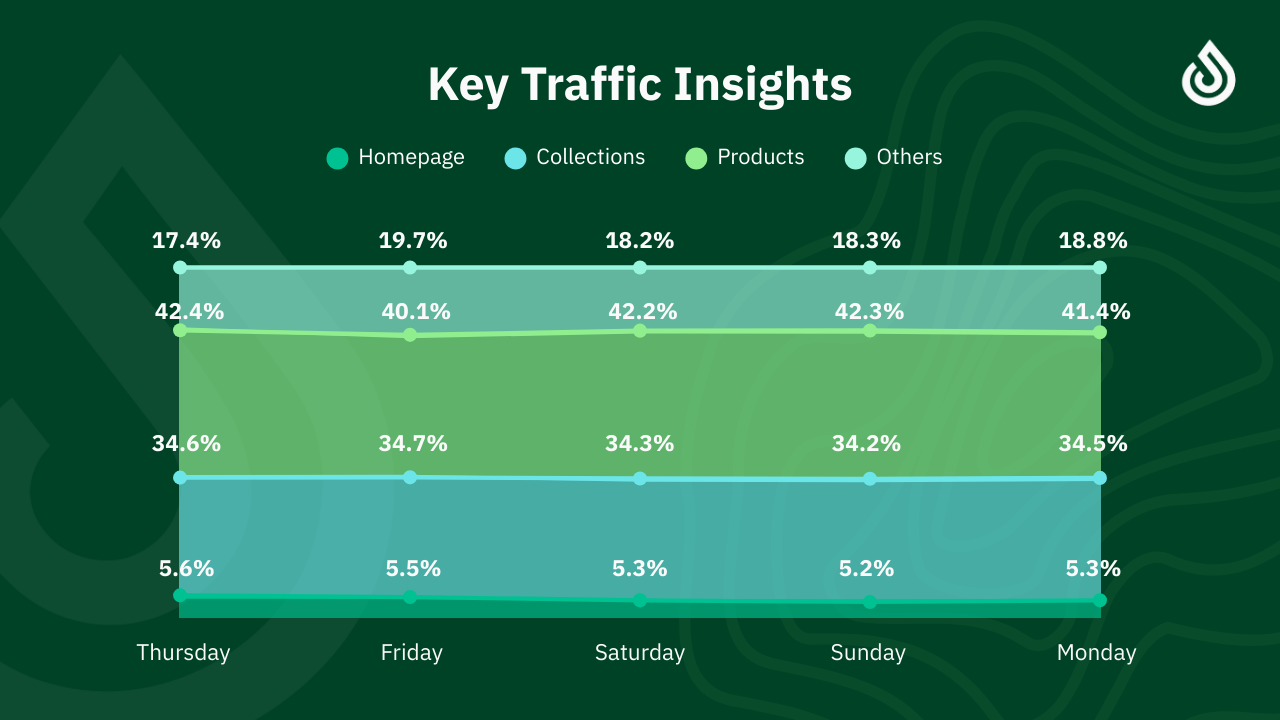
The data shows some remarkably clear patterns in shopper behavior, particularly during peak shopping days. Here's where your visitors are going:
Overall Traffic Distribution (377.9M Total Page Views):
- Homepage: 20.5M views (5.4%)
- Collection Pages: 130.2M views (34.4%)
- Product Pages: 157.0M views (41.5%)
- Other Pages: 70.3M views (18.6%)
But here's what's really interesting: when we look at sessions rather than page views, product pages were viewed in 77.5% of all sessions. This is a massive indicator of purchase intent. Shoppers weren't just browsing, they were actively looking at products with clear buying intent.
Daily Session Patterns by Page Type:
Thursday (Thanksgiving):
- 78.98% of sessions included product page views
- Strong early intent from deal-seekers
Friday (Black Friday):
- 74.97% of sessions included product page views
- Peak traffic day with 101.1M total page views
Sunday:
- 82.21% of sessions included product page views ← Highest product intent
- Shoppers were highly focused on converting
Pro Tip: When nearly 8 out of 10 sessions include product page visits, your product pages are your conversion battleground. Make sure they're optimized with clear CTAs, high-quality images, social proof, and seamless add-to-cart experiences. A/B test everything from button colors to product descriptions.
Conversion Rates & Revenue: The Numbers That Matter
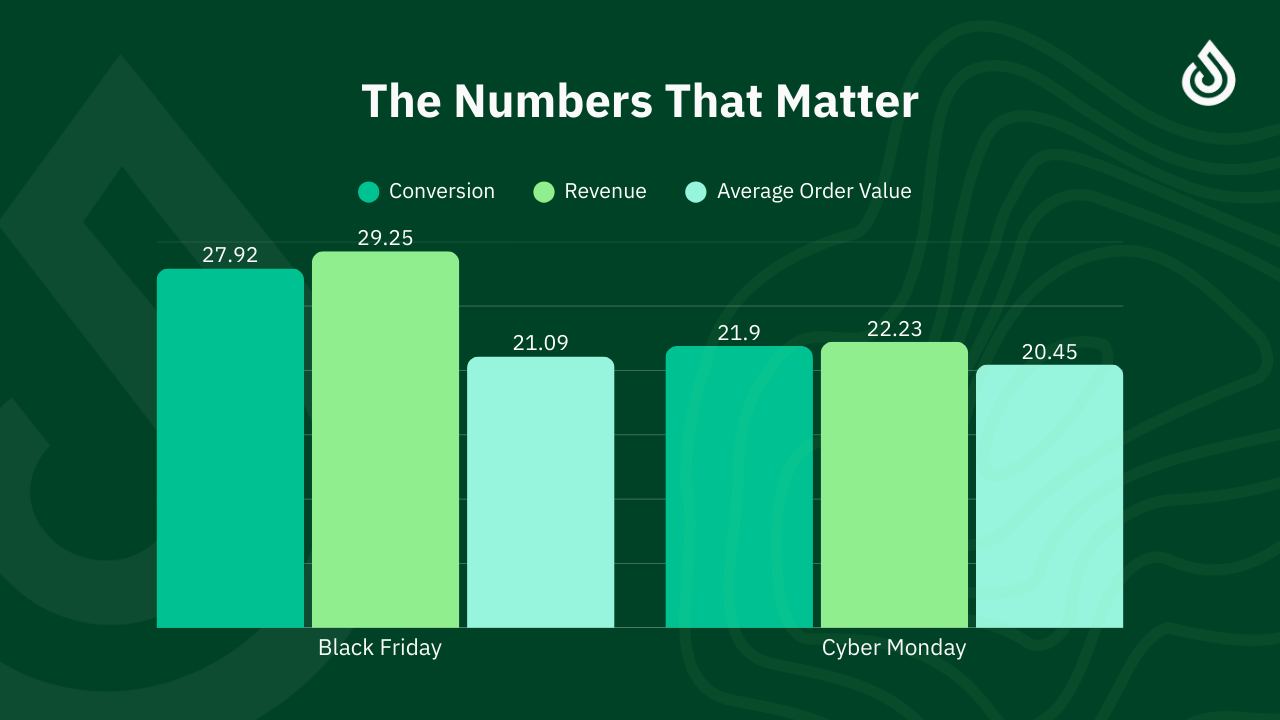
BFCM isn't just about driving traffic, it's about converting that traffic into sales. Here's how the weekend performed:
Daily Conversion Rates:
- Thursday: 13.47% (543,360 conversions)
- Friday: 27.92% (1,126,480 conversions) ← Peak conversion day
- Saturday: 18.22% (734,886 conversions)
- Sunday: 18.49% (746,085 conversions)
- Monday: 21.90% (883,321 conversions)
Total Conversions: 4,034,132
Revenue Distribution:
- Thursday: $64.6M (12.80%)
- Friday: $147.6M (29.25%) ← Dominated revenue
- Saturday: $88.7M (17.58%)
- Sunday: $91.5M (18.14%)
- Monday: $112.2M (22.23%)
Total Revenue: $504,669,143
Average Order Value (AOV):
- Thursday: $119
- Friday: $131 ← Highest AOV of the weekend
- Saturday: $121
- Sunday: $123
- Monday: $127
- Weekend Average: $124
For context, early November (Oct 30-Nov 3) saw an average AOV of just $113, meaning BFCM shoppers were willing to spend nearly 10% more per order during the peak shopping period.
Pro Tip: Black Friday continues to be the undisputed champion, capturing nearly 30% of total conversions and revenue. However, Cyber Monday showed strong momentum with a 21.90% conversion rate, don't overlook Monday deals! The data suggests shoppers are spreading their purchases across the entire weekend, so maintain strong offers throughout.
Purchase Funnel Insights: The Path to Conversion
Looking at the purchase funnel data across BFCM, we tracked 151.6 million total funnel events:
- Sessions: 84.6M
- Product Views: 48.5M
- Add to Cart: 11.9M
- Checkout Started: 6.6M
Friday (Black Friday) saw the biggest surge:
- Sessions jumped 49.52% compared to Thursday
- Product views increased 42.25%
- Add to cart actions spiked 88.98%
- Checkout starts surged 97.66%
This massive Friday spike reinforces that shoppers aren't just browsing, they're ready to buy. The dramatic increase in add-to-cart and checkout actions shows high purchase intent that peaks on Black Friday itself.
How to Apply These Insights for 2026
Here's how you can use these findings to crush next year's peak shopping season:
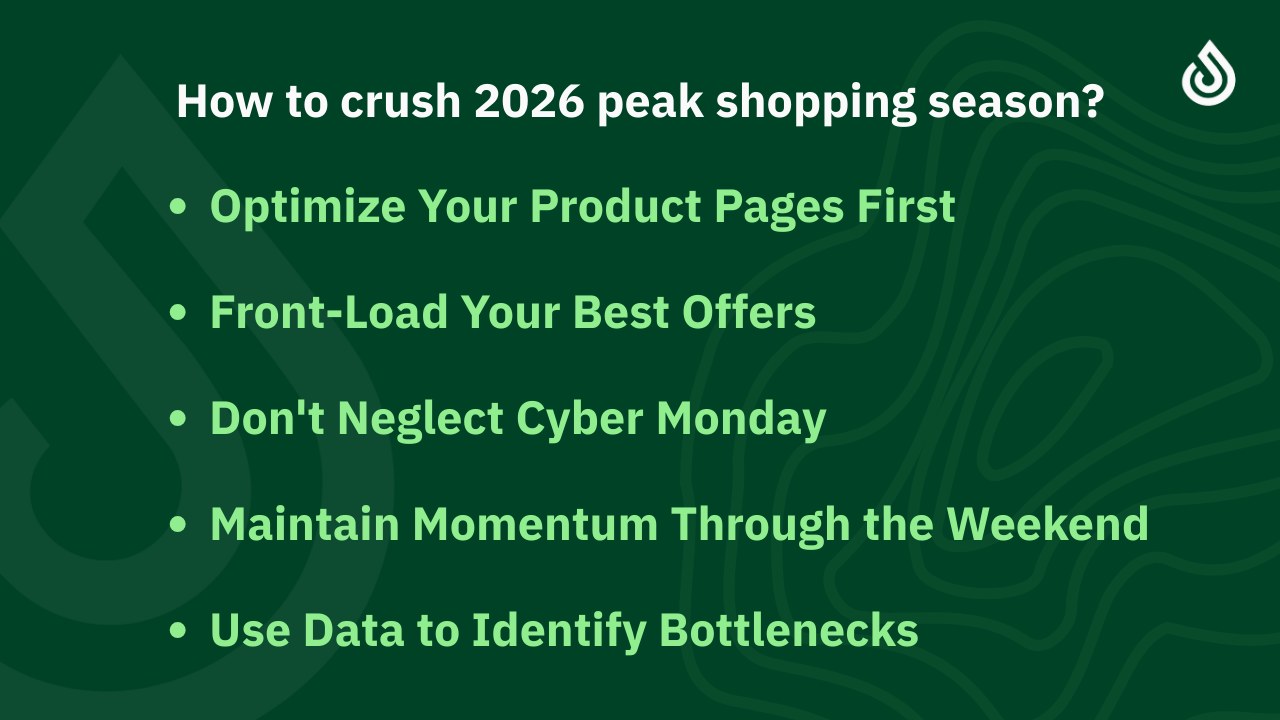
1. Optimize Your Product Pages First With 77.5% of sessions including product page views, these pages are your most critical conversion asset. Focus on:
- Lightning-fast load times
- High-quality product imagery and videos
- Clear, benefit-driven copy
- Prominent CTAs and trust signals
- Mobile-first design (most traffic is mobile)
2. Front-Load Your Best Offers Black Friday captured 27.92% of all conversions and 29.25% of revenue. Start strong on Thursday evening and Friday morning when intent peaks.
3. Don't Neglect Cyber Monday With a 21.90% conversion rate and 22.23% of total revenue, Monday remains a powerhouse day. Many shoppers wait until Monday to make final decisions.
4. Maintain Momentum Through the Weekend Saturday and Sunday combined account for 36.71% of conversions. Keep your team staffed, your inventory stocked, and your site optimized throughout the entire 5-day period.
5. Use Data to Identify Bottlenecks Track the full funnel: sessions → product views → add to cart → checkout. Where are you losing people? Use heatmap's element-level revenue data to identify exactly which page elements are (or aren't) driving conversions.
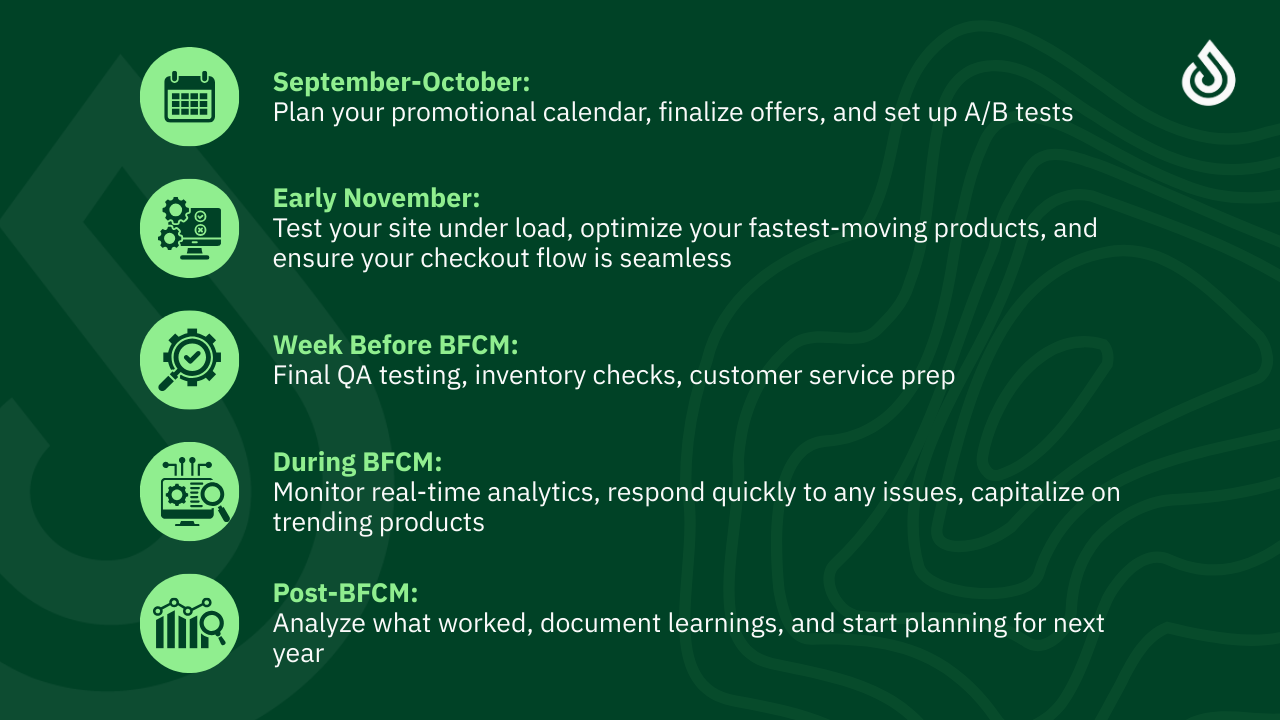
Your 2026 BFCM Prep Checklist
Looking ahead to next year, here's your action plan:
The Bottom Line
The key takeaway from BFCM 2025 is that high-intent traffic demands seamless, optimized experiences. With product pages viewed in over 3 out of 4 sessions, shoppers know exactly what they want, your job is to make it effortless for them to buy.
By leveraging heatmap's tools, like element-level revenue data and interactive session replays, you can understand exactly how users navigate your site, where they're getting stuck, and which elements are driving the most revenue.
Looking forward to BFCM 2026, data-driven optimization will continue to separate the winners from the rest. The insights we've gathered this year are just the beginning.
Let's make sure you're ready to turn these insights into action for next year!

Carina MunroPublished January 2, 2026