
Tracking ecommerce performance has become more complex with Google's shift to Google Analytics 4. Many online store owners find themselves struggling with a platform that seems built for tech experts rather than business owners.
The truth? Most ecommerce sites are tracking inflated revenue numbers, missing critical customer journey data, and spending weeks on technical setup that should take minutes.
In this comprehensive guide, you'll learn:
- How to properly implement GA4 ecommerce tracking (with step-by-step instructions)
- The essential ecommerce events you need to configure for accurate data
- Practical solutions to common GA4 challenges that frustrate most store owners
P.S., We've tested all these implementation methods using heatmapAI, our revenue-focused analytics platform, so if you want to skip the complex GA4 setup and get instant ecommerce insights, we've got you covered.
Key Differences Between GA4 and Universal Analytics eCommerce
If you're migrating from Universal Analytics, understanding these key differences will help you adapt your tracking strategy:
| Feature | Universal Analytics | Google Analytics 4 |
|---|---|---|
| Data Model | Hit-based (pageviews, events, transactions) | Event-based (all interactions are events) |
| Parameter Naming | ecommerce:addToCart, ecommerce:purchase | add_to_cart, purchase |
| Product Data | products array | items array |
| Dimensions | Product-scoped dimensions | Event-scoped and item-scoped dimensions |
| Reporting | Pre-built ecommerce reports | Customizable explorations and reports |
| Transaction Deduplication | Manual implementation required | Automatic for same transaction ID |
Note: As of July 1, 2023, Universal Analytics ceased processing new data, and all users, including GA360, lost access to Universal Analytics properties on July 1, 2024.
One significant change is how GA4 handles ecommerce metrics. For instance, GA4 doesn't include an out-of-the-box ecommerce conversion rate metric like Universal Analytics did. Instead, you'll need to create custom metrics or use session conversion rate as a workaround.
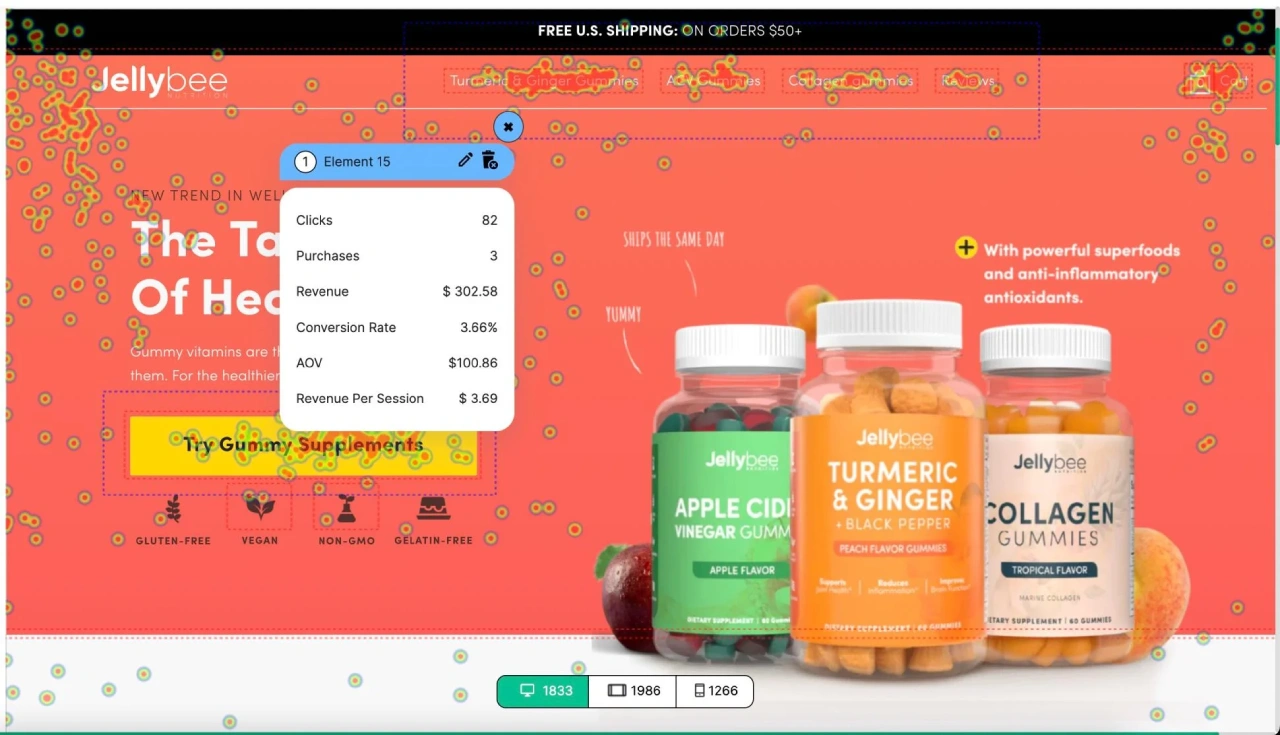
P.S., While GA4 offers powerful customization options, heatmapAI provides revenue-based insights right out of the box, showing exactly how each element on your site contributes to sales without complex configuration.
Essential GA4 eCommerce Events and Parameters
To effectively track your ecommerce data, you need to implement specific events that represent different stages of the customer journey. Each event requires certain parameters to provide meaningful data.
Core eCommerce Events
Here are the essential ecommerce events you should implement in GA4:
| Event Name | Description | Required Parameters |
|---|---|---|
| view_item_list | User views a list of products | items, item_list_id, item_list_name |
| select_item | User clicks on a product from a list | items, item_list_id, item_list_name |
| view_item | User views a product detail page | items, currency, value |
| add_to_cart | User adds item(s) to cart | items, currency, value |
| remove_from_cart | User removes item(s) from cart | items, currency, value |
| view_cart | User views their shopping cart | items, currency, value |
| begin_checkout | User initiates checkout process | items, currency, value |
| add_shipping_info | User selects shipping method | items, currency, value, shipping_tier |
| add_payment_info | User provides payment details | items, currency, value, payment_method |
| purchase | User completes a purchase | transaction_id, items, currency, value, tax, shipping |
| refund | User receives a refund | transaction_id, items (for partial refunds) |
Each of these events provides valuable insights into different stages of your customer journey, helping you identify where users drop off and optimize your conversion funnel.
Required and Optional Parameters
For accurate ecommerce tracking, certain parameters are essential across most events:
Common Parameters Across Events:
- currency: The currency code (e.g., "USD", "EUR")
- value: The monetary value associated with the event
- items: An array containing product information
Items Array Structure:
items: [
  {
    item_id: "SKU_123",
    item_name: "Product Name",
    item_brand: "Brand Name",
    item_category: "Category",
    item_variant: "Variant",
    price: 19.99,
    quantity: 1
  }
]

Event-Specific Parameters:
- For purchase events: transaction_id, tax, shipping
- For add_shipping_info: shipping_tier
- For add_payment_info: payment_type
- For promotions: promotion_id, promotion_name, creative_name
Implementing these parameters correctly ensures your ecommerce data is comprehensive and actionable.
Step-by-Step GA4 eCommerce Implementation
Now that you understand the essential events and parameters, let's walk through the implementation process using both Google Tag Manager and gtag.js.
Implementation with Google Tag Manager
Google Tag Manager (GTM) is the preferred method for implementing GA4 ecommerce tracking as it provides greater flexibility and control.
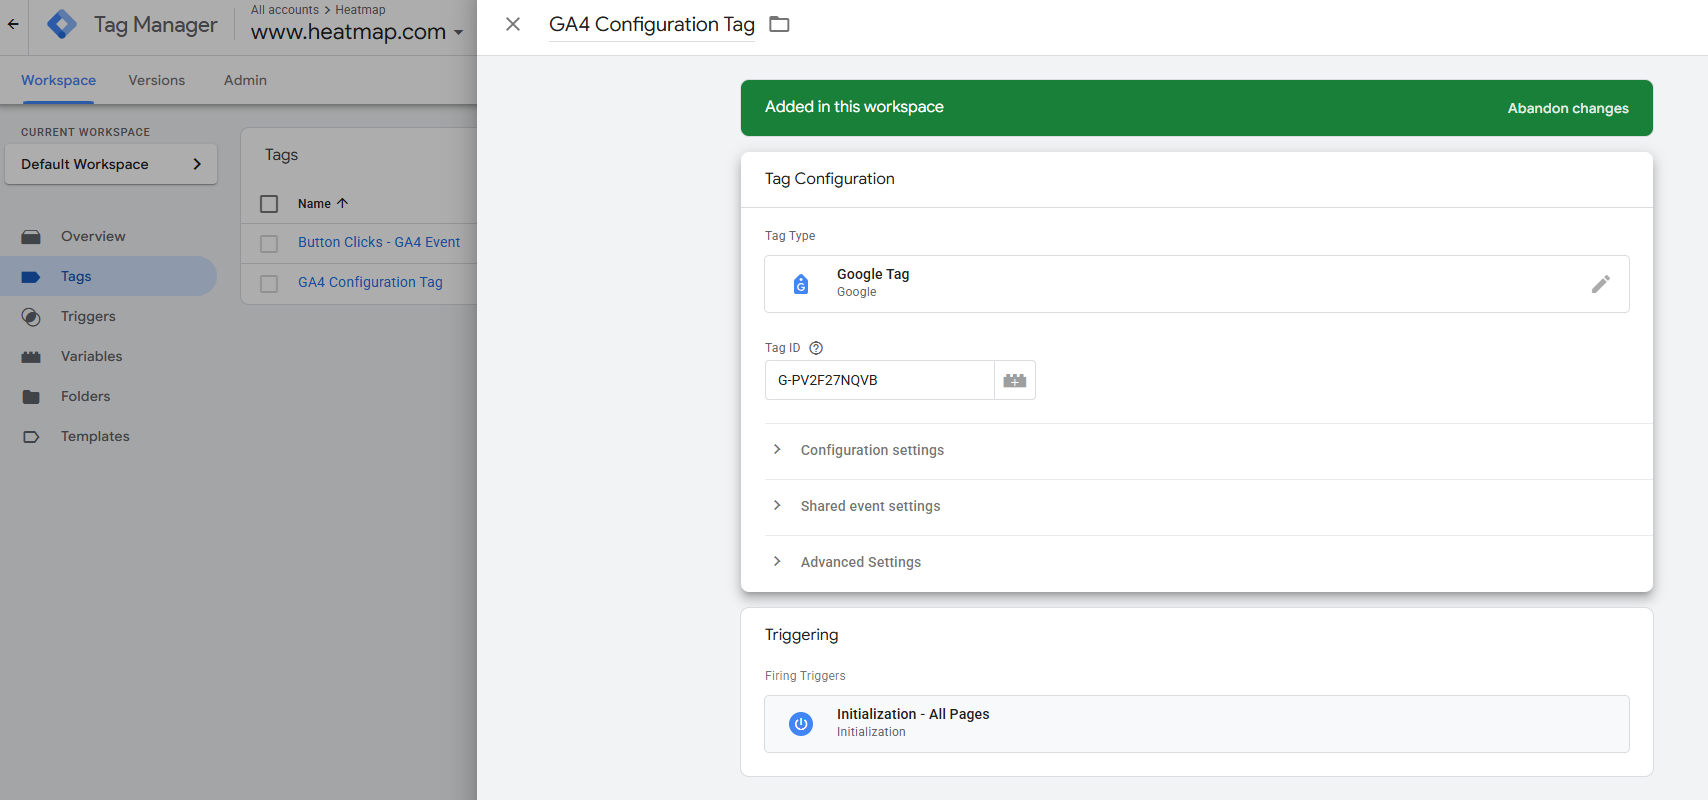
1. Create GA4 Configuration Tag
First, set up your GA4 configuration tag:
- In GTM, go to Tags > New > Google Tag
- Name it: GA4 Configuration Tag
- In Tag ID enter your Measurement ID (format: G-XXXXXXXX)
- Set the trigger to All Pages
- Save the tag
2. Set Up Data Layer Variables
Next, create data layer variables to capture ecommerce data:
- Go to Variables > New > Data Layer Variable
- Create variables for:
- ecommerce.items
- ecommerce.currency
- ecommerce.value
- ecommerce.transaction_id (for purchase events)
- Any other relevant parameters
3. Create Ecommerce Event Tags
For each ecommerce event, create a separate GA4 event tag:
- Go to Tags > New > Google Analytics > Google Analytics: GA4 Event
- Put your main GA4 Measurement ID.
- Enter the event name (e.g., add_to_cart, purchase)
- Under Event Parameters, add:
- items mapped to your {{ecommerce.items}} variable
- currency mapped to {{ecommerce.currency}}
- value mapped to {{ecommerce.value}}
- Any event-specific parameters
- Set the trigger to a custom event matching your data layer push
4. Example Data Layer Push for Purchase Event
Here's how to structure your data layer push for a purchase event:
dataLayer.push({ ecommerce: null });  // Clear previous ecommerce object
dataLayer.push({
  event: "purchase",
  ecommerce: {
    transaction_id: "T12345",
    value: 59.98,
    tax: 4.90,
    shipping: 5.99,
    currency: "USD",
    items: [
      {
        item_id: "SKU_123",
        item_name: "Product Name",
        item_brand: "Brand Name",
        item_category: "Category",
        price: 29.99,
        quantity: 2
      }
    ]
  }
});
Important: Always clear the previous ecommerce object with dataLayer.push({ ecommerce: null }) before pushing a new one to prevent data contamination.
Implementation with gtag.js
If you're not using Google Tag Manager, you can implement GA4 ecommerce tracking directly with gtag.js:
1. Add the GA4 Base Code
First, add the GA4 base code to your site's <head> section:
<!-- Google tag (gtag.js) -->
<script async src="https://www.googletagmanager.com/gtag/js?id=G-XXXXXXXX"></script>
<script>
  window.dataLayer = window.dataLayer || [];
  function gtag(){dataLayer.push(arguments);}
  gtag('js', new Date());
  gtag('config', 'G-XXXXXXXX');
</script>
2. Implement Ecommerce Events
Then, add event-specific code at appropriate points in your user journey:
View Item Example:
gtag("event", "view_item", {
  currency: "USD",
  value: 29.99,
  items: [
    {
      item_id: "SKU_123",
      item_name: "Product Name",
      item_brand: "Brand Name",
      item_category: "Category",
      price: 29.99,
      quantity: 1
    }
  ]
});
Purchase Example:
gtag("event", "purchase", {
  transaction_id: "T12345",
  value: 59.98,
  tax: 4.90,
  shipping: 5.99,
  currency: "USD",
  items: [
    {
      item_id: "SKU_123",
      item_name: "Product Name",
      item_brand: "Brand Name",
      item_category: "Category",
      price: 29.99,
      quantity: 2
    }
  ]
});
Data Layer Structure for GA4 eCommerce
The data layer is crucial for passing ecommerce data to GA4. Here's how to structure it for key events:
Add to Cart Example:
dataLayer.push({ ecommerce: null });
dataLayer.push({
  event: "add_to_cart",
  ecommerce: {
    currency: "USD",
    value: 29.99,
    items: [
      {
        item_id: "SKU_123",
        item_name: "Product Name",
        item_category: "Category",
        price: 29.99,
        quantity: 1
      }
    ]
  }
});
Begin Checkout Example:
dataLayer.push({ ecommerce: null });
dataLayer.push({
  event: "begin_checkout",
  ecommerce: {
    currency: "USD",
    value: 59.98,
    items: [
      {
        item_id: "SKU_123",
        item_name: "Product Name",
        price: 29.99,
        quantity: 2
      }
    ]
  }
});
Best Practices for Data Layer Structure:
- Always clear the previous ecommerce object before pushing a new one
- Include all required parameters for each event
- Use consistent naming conventions for products across all events
- Validate your implementation using GA4 DebugView
Advanced GA4 eCommerce Configurations
Once you've implemented the basic ecommerce tracking, you can enhance your setup with advanced configurations to gain deeper insights into user behavior and optimize your conversion funnel.
Tracking Checkout Steps
Tracking the checkout process helps identify where users abandon their purchases:
1. Begin Checkout Event:
dataLayer.push({ ecommerce: null });
dataLayer.push({
  event: "begin_checkout",
  ecommerce: {
    currency: "USD",
    value: 59.98,
    items: [/* items array */]
  }
});
2. Add Shipping Info Event:
dataLayer.push({ ecommerce: null });
dataLayer.push({
  event: "add_shipping_info",
  ecommerce: {
    currency: "USD",
    value: 59.98,
    shipping_tier: "Next Day",
    items: [/* items array */]
  }
});
3. Add Payment Info Event:
dataLayer.push({ ecommerce: null });
dataLayer.push({
  event: "add_payment_info",
  ecommerce: {
    currency: "USD",
    value: 59.98,
    payment_type: "Credit Card",
    items: [/* items array */]
  }
});
To analyze the checkout flow in GA4, create a funnel exploration:
- Go to Explore > Blank
- Add Exploration technique
- Add begin_checkout, add_shipping_info, add_payment_info, and purchase events as steps
- Analyze where users drop off in the checkout process
Tracking Promotions and Coupons
Tracking promotions helps measure the effectiveness of your marketing efforts:
1. View Promotion Event:
dataLayer.push({ ecommerce: null });
dataLayer.push({
  event: "view_promotion",
  ecommerce: {
    promotion_id: "PROMO_1234",
    promotion_name: "Summer Sale",
    creative_name: "summer_banner",
    creative_slot: "banner_slot_1",
    items: [/* items array */]
  }
});
2. Select Promotion Event:
dataLayer.push({ ecommerce: null });
dataLayer.push({
  event: "select_promotion",
  ecommerce: {
    promotion_id: "PROMO_1234",
    promotion_name: "Summer Sale",
    creative_name: "summer_banner",
    creative_slot: "banner_slot_1",
    items: [/* items array */]
  }
});
3. Tracking Coupons at Purchase:
dataLayer.push({ ecommerce: null });
dataLayer.push({
  event: "purchase",
  ecommerce: {
    transaction_id: "T12345",
    value: 59.98,
    coupon: "SUMMER20", // Order-level coupon
    items: [
      {
        item_id: "SKU_123",
        item_name: "Product Name",
        coupon: "ITEM10", // Item-level coupon
        price: 29.99,
        quantity: 2
      }
    ]
  }
});
Custom Dimensions and Metrics
Custom dimensions and metrics allow you to track additional data specific to your business:
- Create a Custom Dimension in GA4:
- Go to Admin > Custom Definitions > Create Custom Dimensions
- Enter a name (e.g., "Customer Type")
- Select scope (User, Session, or Event)
- Enter the event parameter (e.g., "customer_type")
- Send Custom Dimension with Purchase Event:
dataLayer.push({ ecommerce: null });
dataLayer.push({
  event: "purchase",
  ecommerce: {
    transaction_id: "T12345",
    value: 59.98,
    currency: "USD",
    items: [/* items array */]
  },
  customer_type: "returning" // Custom dimension
});
Remember that GA4 has limits on custom dimensions (10 for free accounts, 25 for GA360), so prioritize the most important business metrics.
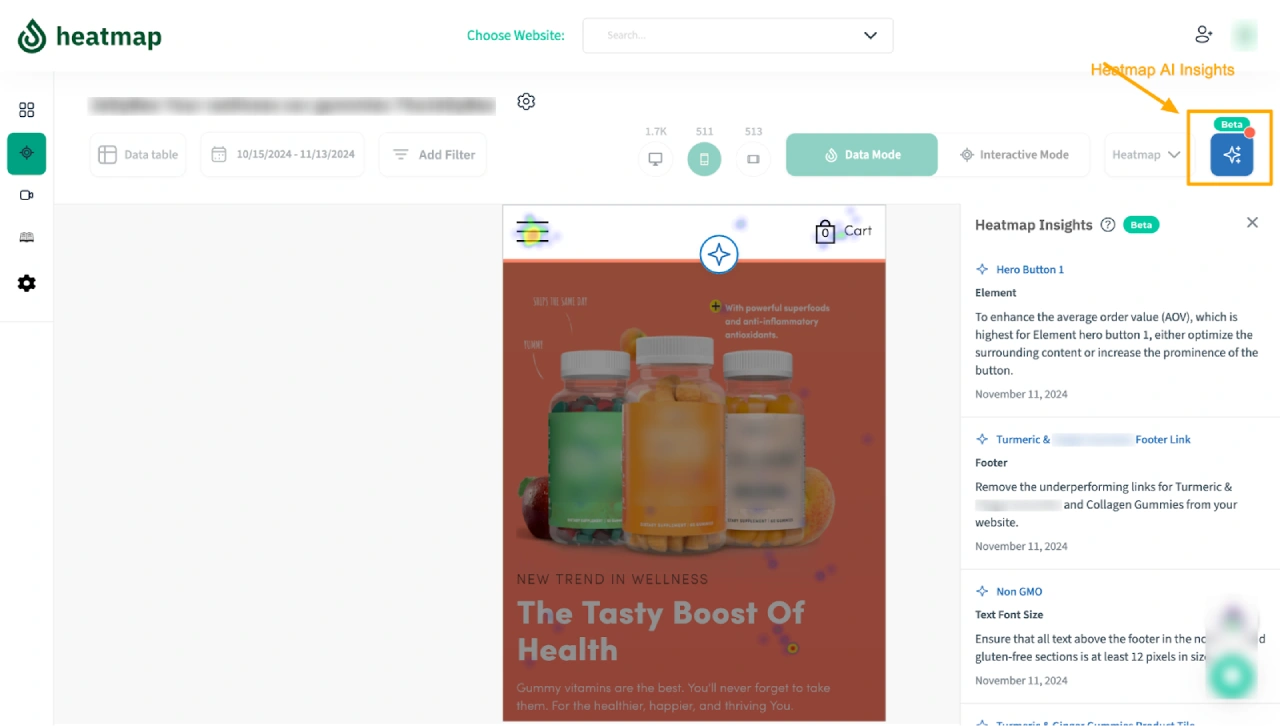
P.S., heatmap takes analytics a step further. The tool automatically segments users by behavior patterns and provides 500+ AI-driven recommendations to optimize your site for higher revenue per session.
GA4 eCommerce Reports and Analysis
After implementing ecommerce tracking, you'll want to analyze the data to gain insights and optimize your online store's performance.
Available eCommerce Reports in GA4
GA4 provides several built-in reports for analyzing ecommerce data:
- Monetization Overview:
- Access via Reports > Monetization > Overview
- Shows key metrics like total revenue, average purchase revenue, and ecommerce purchases
- Ecommerce Purchases Report:
- Access via Reports > Monetization > Ecommerce purchases
- Displays purchase trends, top-selling items, and purchase source/medium
- Items Report:
- Access via Reports > Monetization > Items
- Shows performance metrics for individual products
- Creating Custom Explorations:
- Go to Explore > Blank
- Create custom reports like:
- Product performance comparison
- Checkout funnel analysis
- Cart abandonment analysis
- Promotion effectiveness
Key Metrics to Track
Focus on these essential ecommerce metrics to evaluate your store's performance:
- Conversion Rates:
- Overall Conversion Rate: Total transactions ÷ Total sessions
- Product Conversion Rate: Product purchases ÷ Product page views
- Cart-to-Purchase Rate: Purchases ÷ Add to cart events
- Average Order Value (AOV):
- Total revenue ÷ Number of transactions
- Track changes over time and by marketing channel
- Revenue Per User:
- Total revenue ÷ Number of users
- Helps identify high-value customer segments
- Cart Abandonment Rate:
- (Add to cart events - Purchase events) ÷ Add to cart events
- High rates indicate friction in the checkout process
To create a custom report for these metrics:
- Go to Explore > Blank
- Add dimensions like Date, Source/Medium, or Device category
- Add metrics like Ecommerce purchases, Purchase revenue, and Average purchase revenue
- Create calculated metrics for conversion rates and abandonment rates
Pro Tip: Create segments to compare metrics between different user groups, such as new vs. returning customers or mobile vs. desktop users.
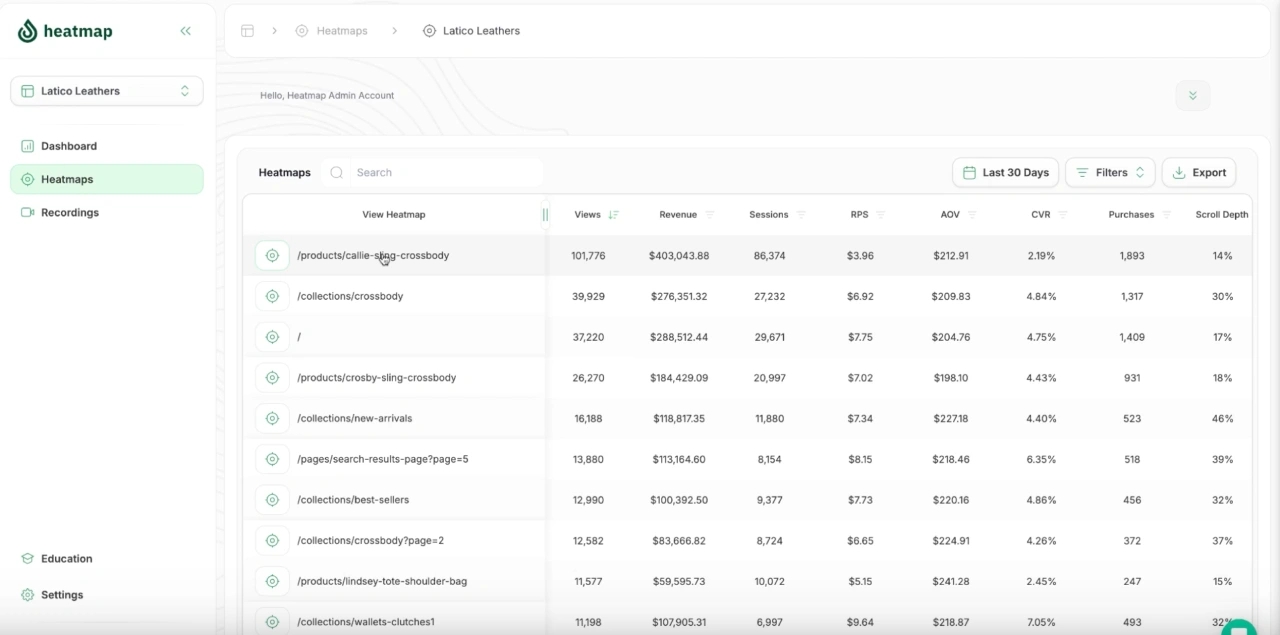
BTW, heatmapAI provides these key metrics out of the box, plus unique insights like revenue per click and element, showing exactly which parts of your site drive the most value—something GA4 can't do.
Common GA4 eCommerce Tracking Challenges and Solutions
Even with careful implementation, you may encounter challenges with GA4 ecommerce tracking. Here are solutions to common issues:
Data Sampling and Volume Issues
Challenge: GA4 may sample data when you have high event volumes, leading to incomplete or inaccurate reporting.
Solutions:
1. Track State Changes, Not Individual Actions:
// Instead of firing an event for each item added:
window.cartState = window.cartState || [];

function updateCart(product, quantity) {
  // Update cart state
  let existingItem = window.cartState.find(item => item.item_id === product.item_id);
  if (existingItem) {
    existingItem.quantity += quantity;
  } else {
    window.cartState.push({...product, quantity: quantity});
  }

  // Fire a single add_to_cart event with updated cart
  dataLayer.push({ ecommerce: null });
  dataLayer.push({
    event: "add_to_cart",
    ecommerce: {
      currency: "USD",
      value: calculateCartValue(window.cartState),
      items: window.cartState
    }
  });
}
2. Use Throttling for High-Volume Events: Implement a throttling function to limit the frequency of events:
function throttle(func, delay) {
  let lastCall = 0;
  return function(...args) {
    const now = new Date().getTime();
    if (now - lastCall < delay) {
      return;
    }
    lastCall = now;
    return func(...args);
  };
}

const throttledEvent = throttle(function(eventData) {
  dataLayer.push(eventData);
}, 1000); // Limit to once per second
3. Monitor BigQuery Export Limits: If using BigQuery export, be aware of the daily export limits and optimize your event structure to reduce data volume.
Duplicate Transaction Detection
Challenge: Duplicate transactions can skew revenue reporting if users refresh the order confirmation page.
Solutions:
- Use Unique Transaction IDs: Ensure each transaction has a unique ID that won't be reused, even if the page is refreshed.
- Implement Server-Side Tracking: Send the purchase event from your server after order confirmation to prevent duplicate events.
- Use Local Storage to Prevent Duplicates:
function trackPurchase(transactionData) {
  // Check if this transaction was already tracked
  const trackedTransactions = JSON.parse(localStorage.getItem('trackedTransactions') || '[]');
  if (trackedTransactions.includes(transactionData.transaction_id)) {
    return; // Skip if already tracked
  }

  // Track the purchase
  dataLayer.push({ ecommerce: null });
  dataLayer.push({
    event: "purchase",
    ecommerce: transactionData
  });

  // Save to tracked transactions
  trackedTransactions.push(transactionData.transaction_id);
  localStorage.setItem('trackedTransactions', JSON.stringify(trackedTransactions));
}
Cross-Domain Tracking
Challenge: Losing user data when customers navigate between different domains in your checkout process.
Solution: Configure cross-domain tracking in your GA4 configuration tag:
- In Google Tag Manager:
- Edit your GA4 Configuration tag
- Under "Fields to Set", add:
- linker_domains: comma-separated list of domains
- link_attribution: true
- With gtag.js:
gtag('config', 'G-XXXXXXXX', {
  linker: {
    domains: ['checkout.example.com', 'shop.example.com']
  }
});
This ensures that the GA4 client ID is preserved when users navigate between your domains.
GA4 eCommerce Tracking Limitations (and How to Overcome Them)
While GA4 offers powerful ecommerce tracking capabilities, it has several limitations that can impact your ability to make data-driven decisions. Let's explore these limitations and how to address them.
Reporting Delays
Limitation: GA4 typically has a 24-48 hour delay before data is fully processed and available in reports, making it difficult to respond quickly to issues or opportunities.
Solutions:
- Use GA4's real-time reports for immediate but limited insights
- Implement a complementary real-time analytics solution
- Set up automated alerts for critical metrics to minimize reaction time
While GA4 provides comprehensive data, its 24-hour reporting delay can be problematic for time-sensitive ecommerce decisions. Tools like Heatmap offer real-time analytics that show you revenue impact immediately, helping you identify and fix issues before they affect your bottom line.
Complex Setup Requirements
Limitation: Properly implementing GA4 ecommerce tracking requires significant technical knowledge and developer resources.
Solutions:
- Use a tag management system like Google Tag Manager to simplify implementation
- Create a detailed implementation plan with clear documentation
- Consider using a GA4-compatible analytics plugin for your ecommerce platform
- Invest in training for your team or hire a GA4 specialist
GA4 ecommerce tracking often requires 20-40 hours of developer time for proper setup. In contrast, Heatmap's analytics solution works out of the box with no custom code, providing immediate insights into how your site elements impact revenue.
Revenue Calculation Accuracy
Limitation: GA4 typically reports gross revenue without accounting for discounts, refunds, or canceled orders, potentially inflating your sales figures.
Solutions:
- Create custom metrics that account for discounts and refunds
- Implement separate tracking for refunds and cancellations
- Regularly reconcile GA4 data with your actual financial data
GA4 typically inflates revenue by 15-20% by reporting gross sales without accounting for discounts and promotions. Heatmap tracks net revenue automatically, giving you accurate data for making informed business decisions.
Limited Historical Data
Limitation: GA4 only retains user-level and event-level data for a maximum of 14 months, making long-term trend analysis difficult.
Solutions:
- Set up BigQuery export to store your raw GA4 data indefinitely
- Create regular data exports for long-term storage
- Establish baseline metrics and KPIs to track changes over time
Implementation Example for BigQuery Export:
- Go to Admin > Data Streams > [Your Web Stream]
- Click on BigQuery Links > Link
- Select your BigQuery project and dataset
- Choose your export frequency (daily or streaming)
This ensures you maintain access to your historical ecommerce data beyond GA4's retention limits.
User Privacy and Consent Management
Limitation: GA4's cookie-based tracking is increasingly affected by privacy regulations and browser restrictions.
Solutions:
- Implement a consent management platform (CMP) to collect and manage user consent
- Use Google's Consent Mode to adjust tracking based on user consent
- Consider server-side tracking to reduce reliance on client-side cookies
Consent Mode Implementation:
gtag('consent', 'default', {
  'ad_storage': 'denied',
  'analytics_storage': 'denied'
});

// Later, after obtaining consent:
gtag('consent', 'update', {
  'ad_storage': 'granted',
  'analytics_storage': 'granted'
});
By addressing these limitations, you can maximize the value of your GA4 ecommerce tracking while ensuring accurate and actionable data.
GA4 eCommerce Tracking Best Practices
To get the most out of your GA4 ecommerce implementation, follow these best practices that will ensure accurate data and actionable insights.
Data Layer Structure and Management
1. Standardize Your Data Layer Format:
- Use consistent naming conventions across your site
- Document your data layer structure for future reference
- Follow Google's recommended event and parameter names
2. Clear eCommerce Objects Between Pushes: Always clear the previous ecommerce object before pushing a new one:
dataLayer.push({ ecommerce: null });
dataLayer.push({
  event: "view_item",
  ecommerce: {
    // New ecommerce data
  }
});
3. Track State Changes, Not Individual Actions: Instead of firing multiple events for similar actions (like adding multiple products to cart), update a state object and fire a single event with the complete state.
4. Error Handling and Validation: Implement error handling to prevent broken tracking:
function safeTrackEvent(eventName, eventData) {
  try {
    // Validate required fields
    if (!eventData.ecommerce || !eventData.ecommerce.items) {
      console.error("Missing required ecommerce data");
      return;
    }

    dataLayer.push({ ecommerce: null });
    dataLayer.push({
      event: eventName,
      ecommerce: eventData.ecommerce
    });
  } catch (error) {
    console.error("Error tracking event:", error);
  }
}
Testing and Validation
1. Use GA4 DebugView:
- Enable debug mode when testing:
gtag('config', 'G-XXXXXXXX', { 'debug_mode': true });
- Verify events in real-time using the DebugView report in GA4
2. Common Testing Scenarios:
- Test the complete purchase flow from product view to checkout
- Verify refund tracking
- Test promotion clicks and views
- Check cross-domain tracking if applicable
3. Validation Checklist:
- Confirm all required parameters are present in each event
- Verify that currency and value parameters are consistent
- Check that transaction IDs are unique
- Ensure item data is consistent across events
4. Use Google Tag Assistant: Install the Google Tag Assistant Chrome extension to debug your implementation and identify issues.
Performance Optimization
- Minimize Tag Impact on Site Speed:
- Load analytics scripts asynchronously
- Use a tag manager to control loading priority
- Consider server-side tagging for critical pages
- Efficient Data Collection Strategies:
- Batch events when possible instead of sending them individually
- Prioritize critical events and defer less important ones
- Use sampling for high-volume, low-value events
- Optimize Data Layer Size:
- Only include necessary data in your data layer
- Avoid duplicating information across events
- Remove any sensitive or personally identifiable information
While implementing multiple tracking scripts can impact site performance, Heatmap's lightweight script is designed for minimal impact on page load times while still providing comprehensive analytics.
Regular Auditing and Maintenance
- Periodically Review Your Implementation:
- Check for missing or broken events
- Verify that new products and categories are being tracked correctly
- Compare GA4 data with your ecommerce platform's reports
- Stay Updated with GA4 Changes:
- Follow Google's release notes for GA4 updates
- Adjust your implementation as new features are released
- Be aware of deprecation notices for older features
- Document Your Implementation:
- Maintain a tracking plan document
- Record any custom configurations or workarounds
- Create a data dictionary for custom dimensions and metrics
By following these best practices, you'll ensure that your GA4 ecommerce tracking provides accurate, reliable data that you can use to make informed business decisions.
Bridging the Data-Action Gap: From Analytics to Revenue Optimization
Traditional analytics platforms like GA4 provide mountains of data about your ecommerce store's performance, but many businesses struggle to translate these metrics into concrete actions that drive revenue. This disconnect between data collection and revenue-generating decisions represents one of the biggest challenges in ecommerce analytics today.
The Problem with Data Overload
GA4 offers unprecedented access to ecommerce data points:
- Detailed user journey tracking across multiple touchpoints
- Granular event tracking throughout the conversion funnel
- Advanced segmentation capabilities for audience analysis
- Cross-device and cross-platform user tracking
However, this wealth of information often leads to analysis paralysis rather than actionable insights. Ecommerce teams find themselves asking:
- "Which of these metrics should we prioritize?"
- "How do we connect this data to actual revenue impact?"
- "What specific changes should we make based on these numbers?"
- "Which elements on our site are underperforming or overperforming?"
The fundamental challenge isn't data collection—it's translating that data into revenue-focused decisions.
Connecting Analytics to Revenue Impact
The most valuable analytics solutions bridge this gap by directly connecting user behavior to revenue outcomes:
- Element-Level Revenue Attribution:
- Identify which specific buttons, images, and content blocks generate the most revenue
- Quantify the exact value of each component on your product and category pages
- Prioritize optimization efforts based on revenue potential, not just click rates
- Behavioral Revenue Patterns:
- Discover which user interaction patterns correlate with higher average order values
- Identify the behaviors that distinguish purchasers from non-purchasers
- Understand how different traffic sources interact with your site in revenue-generating ways
- Revenue Leakage Detection:
- Pinpoint exactly where potential revenue is being lost in your funnel
- Quantify the financial impact of specific user experience issues
- Calculate the potential ROI of fixing each identified problem
From Data Points to Dollar Signs
Consider these examples of how behavior-focused analytics transforms abstract data into concrete revenue impact:
| Traditional Analytics | Revenue-Focused Insight | Business Impact |
|---|---|---|
| 30% of users drop off at checkout | Users who encounter shipping calculator errors represent $42,000 in lost revenue monthly | Fixing the calculator could recover $504,000 annually |
| Product page has 1:45 avg. time on page | Users who scroll to the reviews section generate 2.8x more revenue than those who don't | Moving reviews higher could increase revenue per session by 35% |
| 60% of mobile users exit from category pages | Mobile users who use filters convert at 3x the rate but only 15% find the filter button | Making filters more prominent could add $250,000 quarterly |
| Email campaigns have 2.3% conversion rate | Email visitors who view the "Bestsellers" section first generate 40% more revenue | Updating email links could increase campaign value by $80,000 monthly |
This approach transforms analytics from a reporting exercise into a revenue optimization tool by connecting every data point to its financial impact.
Advanced Visualization Tools for Revenue Insights
While GA4 provides numerical data, advanced analytics platforms offer visual tools that reveal the "why" behind user behavior and its impact on revenue:
- Revenue-Based Heatmaps: Unlike standard heatmaps that only show where users click, revenue-based heatmaps display exactly how much money each element on your page generates. This revolutionary approach transforms your understanding of what truly matters on your site:
- Identify high-value vs. low-value elements based on actual revenue contribution
- Discover which product images, buttons, or content blocks drive the most sales
- Compare revenue patterns between different user segments (high vs. low AOV customers, new vs. returning visitors)
- Make design decisions based on financial impact rather than just engagement metrics
- Interactive Scrollmaps with Revenue Correlation: Standard scrollmaps show how far users scroll down your page, but revenue-focused scrollmaps reveal the relationship between scroll depth and purchasing behavior:
- Pinpoint exact fold positions where revenue potential drops significantly
- Identify content sections that drive disproportionate revenue when viewed
- Discover the optimal placement for key conversion elements based on revenue data
- Detect when high-value content is positioned too far down the page for most visitors to see
- Session Recordings: Advanced analytics platforms allow you to focus on the most valuable interactions:
- Compare high-value vs. low-value customer journeys to spot critical differences
- Identify common behaviors among your highest-spending customers
- Spot usability issues that specifically affect purchasing decisions
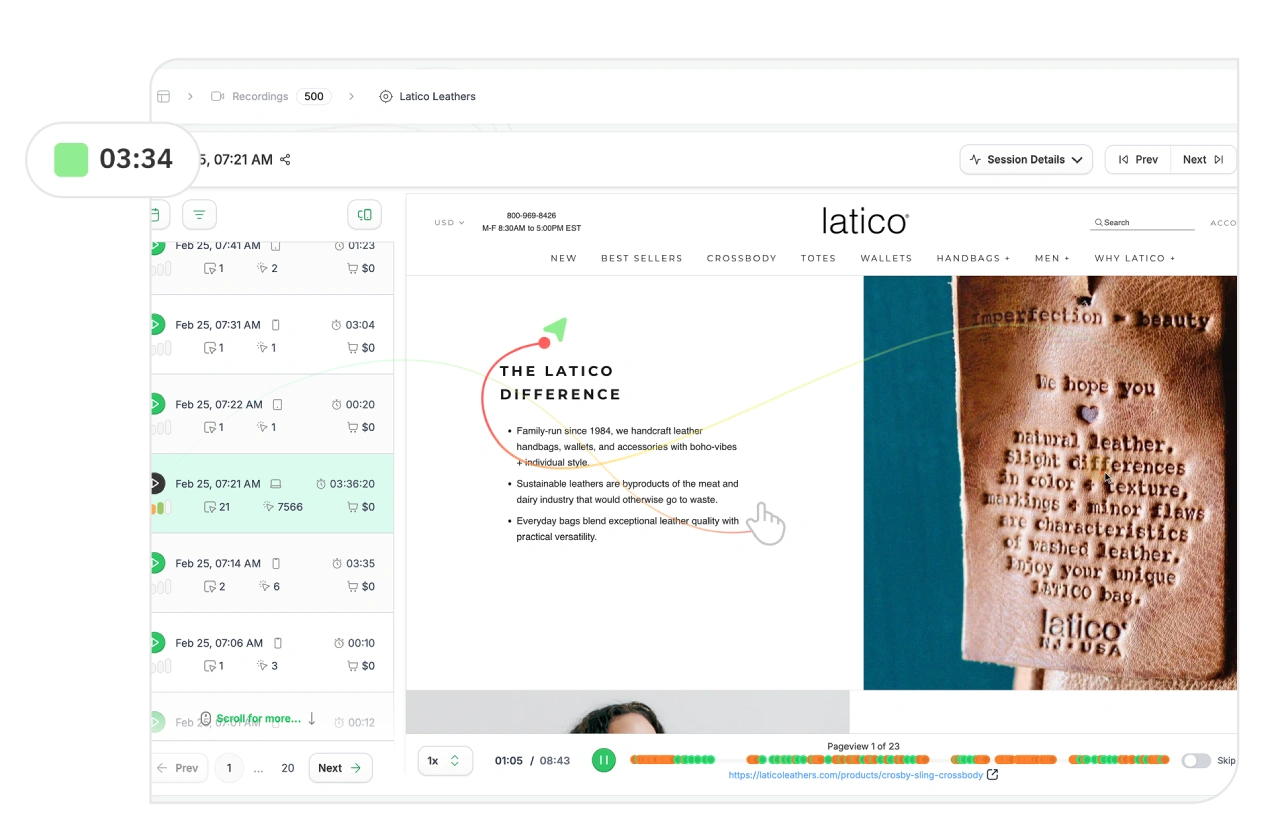
4. AI-Powered Recommendations: The most advanced platforms go beyond showing data to providing specific, revenue-focused recommendations:
- Receive actionable suggestions for element placement, copy improvements, and UX enhancements
- Identify JavaScript errors and technical issues affecting your conversion rate
P.S., heatmapAI combines all these approaches in one platform, with unique capabilities like revenue-attributed heatmaps that show exactly which elements drive sales. Our interactive scrollmaps reveal revenue drop-off points, while our filtered session recordings help you understand the behaviors of your highest-value customers.
Plus, our AI engine provides over 500 recommendations specifically designed to boost your revenue per session—all without the complex setup required by GA4.
Make Data-Driven Decisions Simple with heatmapAI
GA4 ecommerce tracking gives you powerful data capabilities, but it comes with significant setup hurdles and limitations.
Key Takeaways
- Event-based tracking forms the foundation of effective GA4 ecommerce analytics
- Google Tag Manager provides the most control over your implementation
- Regular testing is crucial to maintain data accuracy
- Proper event configuration ensures you capture the full customer journey
While GA4 offers valuable insights, its 24-hour reporting delays, complex setup requirements, and lack of revenue attribution to specific page elements can limit your ability to make quick, impactful decisions.
So, if you're looking to complement GA4 or seeking a simpler solution, heatmap's out-of-the-box ecommerce analytics provide immediate revenue insights without custom code.
Our revenue-based heatmaps, scrollmaps, and screen recordings show exactly which elements drive sales, helping you boost revenue with data-driven decisions that impact your bottom line today—not tomorrow.
You made it all the way down there? Give Heatmap a try 🤝
We are the only onsite analytics platform that tells you how to make more money - down to the pixel. Trusted by 1000+ eCommerce brands.

Ashvin Melwani
@ashvinmelwaniWith heatmap, I've been able to figure out what elements actually increase AOV and optimize our landing pages to drive more first purchase profitability, we're up 23% YoY.


Dylan AnderPublished June 2, 2025