So you’re getting traffic to your site. You’re running campaigns. People are showing up, but not enough are buying. Something is wrong, but you can’t fix what you don’t know. You need to understand where users are dropping off in their buying journey to boost conversion rates.
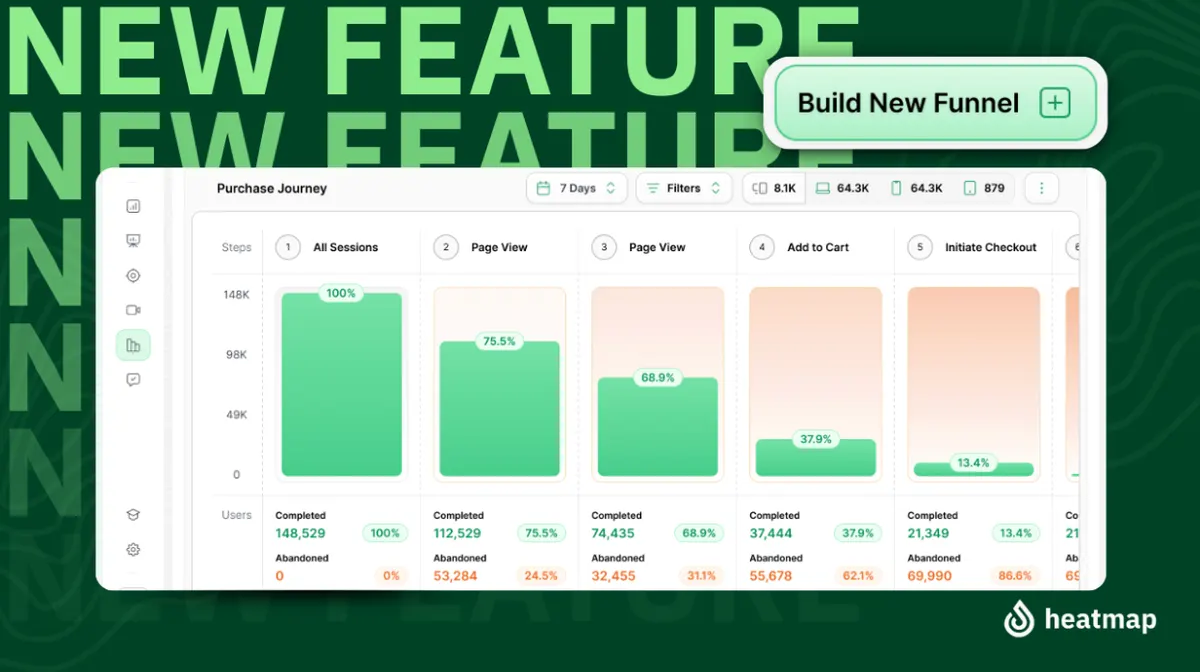
We're excited to announce Heatmap’s newest feature, Heatmap Funnels. This quick and powerful tool in Heatmap’s CRO suite is designed to help you visualize and understand how your visitors move (or don’t move) through your site.
If you’ve ever stared at your analytics wondering why conversion dropped off a cliff, Funnels is your answer. Funnels show you where users drop off in your buying journey, so you can stop wasting time fixing the wrong things and focus on what drives results. This isn’t another “insight” buried in GA4. It’s a straightforward, visual roadmap that helps you understand user behavior, reduce friction, and turn more sessions into sales.
What Are Ecommerce Funnels (and Why They Matter)
Funnels give you a step-by-step breakdown of your customer journey, from homepage to purchase, and every step in between. For example, if you have a high cart abandonment rate and not enough users converting to customers, there may be a friction point somewhere in the customer journey.
Ecommerce funnels matter to analyze where you can improve the customer journey. Funnels allow you to:
✅ See where customers stop moving forward.
✅ Identify what’s causing friction or hesitation.
✅ Fix the leaks that are quietly draining your revenue.
✅ Optimize CRO strategies to generate lost revenue.
For ecommerce marketers, this means clarity and real-time data. Heatmap reports allow you to analyze the data from your funnels to make data-driven decisions in your CRO strategies. This informs you what to A/B test next, where you can improve cart abandonment strategies and email campaigns, and what key messages you need to retarget your visitors.
Why We Built Funnels
We built funnels as a visual, diagnostic tool that shows how people move (or don’t) through your site, where they’re bailing, and what’s killing your revenue. We wanted to give you more access and an in-depth look at your data in real-time.
For example, let’s say you're seeing high traffic from an ad campaign, but not enough revenue conversions. A Heatmap funnel can show you if there is a high drop-off rate after a visitor visits your landing page, or if there is a friction point at checkout.
With your funnel data, you can act by optimizing your site's landing page copy or A/B testing images. A funnel can show you where to prioritize A/B tests, CRO efforts, UI/UX enhancements, and any bug fixes causing your customer friction.
Building your funnels in Heatmap allows you to set your goal (like Purchase) and map out each key step leading up to it, such as the homepage, product page, add-to-cart, checkout, etc. Funnels instantly show you how many users complete each step and how many drop off. There are no spreadsheets, no guesswork, just answers.
Build your first funnel in minutes. Book a call and learn more about Heatmaps full CRO features.
What You Can Track in Funnels:
Here are a few high-value funnels to build right away:
- 🛒 Purchase Funnel: Track your full journey from interest to checkout. A purchase funnel is great for finding your ecommerce store’s baseline data points, such as cart abandonment and conversion rates.
- 📦 Product Funnel: Focus on one item or category. A product funnel is great for evaluating a specific product's performance and discovering where you can A/B test or improve the customer's UI and UX.
- 💸 Cart Abandonment Funnel: Drill into bottom-of-funnel drop-offs. Cart abandonment funnels are great for discovering lost revenue and help build a picture of why the buyer hesitated to click purchase at the most critical stage of the buying journey.
- 📈 Landing Page Funnel: Measure campaign traffic and post-click flow. Landing page funnels are excellent if you run multiple ads or email campaigns to discover real-time data on their performance. You can see if the landing page resonates with your customers who click through and where they fall off the funnel.
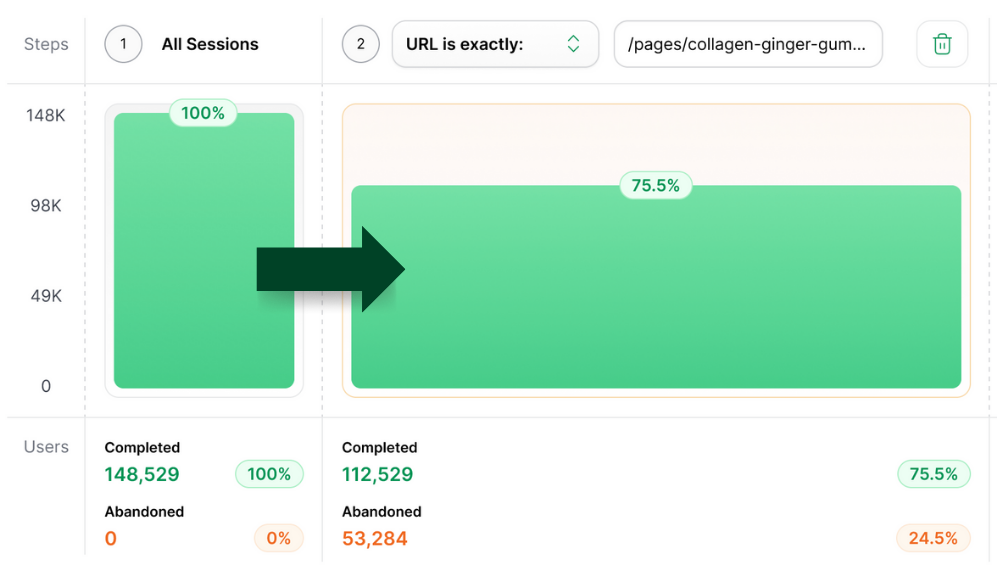
How to Build Your First Funnel (5-Minute Setup)
- Go to the Funnels section in your heatmap dashboard
- Click “Build New Funnel”
- Name it
- Add steps using URL rules or key events like Add to Cart, Checkout, and Purchase
- Save it. Done.
Every funnel is automatically visualized and saved to your dashboard, ready to analyze.
Access the Funnels User Guide for an in-depth look into building your funnel in the Heatmaps Dashboard
Reading Funnel Reports Like a Marketer (Not a Data Analyst)
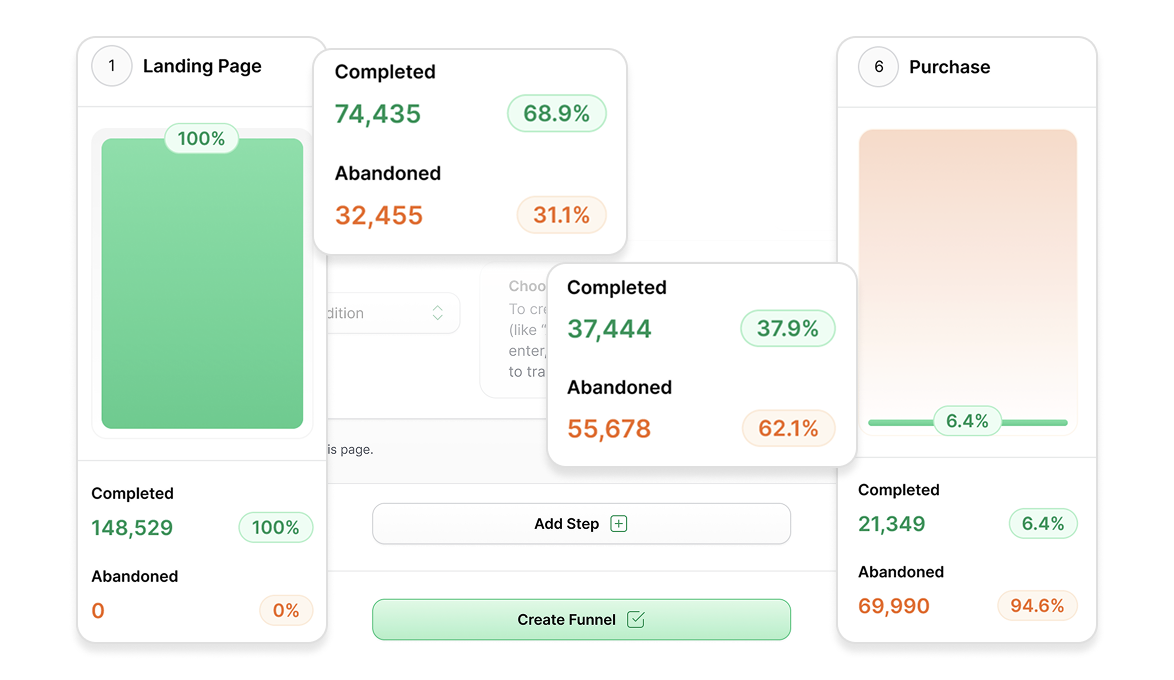
Funnels give you real-time data to analyze. Each step in the funnel shows two percentage numbers, those who move forward in your funnel and those who drop off.
- % Completed: Users who moved forward from the step you initiated.
- % Abandoned: Users who bailed and dropped off. This percentage is from the previous first step.
This makes it dead simple to spot high-friction moments. For example, was there a big drop between the product page and add to cart. That’s a signal to fix something in between those steps. Another example would be if your users are stalling at checkout. Not quite hitting purchase. There may be an opportunity to add a sense of urgency in your cart abandonment emails, or there's a friction point on the checkout page.
Pair funnel data with heatmaps and screen recordings, and you’ll have a complete picture of why drop-offs are happening and how to fix them.
Best Practices (and how to avoid messy data)
Integrate other tools such as surveys, heatmaps, and screen recordings to understand your user behavior. When you notice a major drop-off, review the pages or events in the step or two before to identify potential causes.
Here are some best practices we recommend to make the most out of Heatmap Funnels and avoid messy data.
- Set clear goals when building your funnel to generate a specific outcome.
- Avoid overcomplicating your funnels and keep them focused. Too many steps and dilute your insights and data, making it hard to pinpoint what is causing drop-offs.
- Make sure all key steps in the customer journey are properly tracked so your funnel reflects real user behavior.
- Focus optimization efforts on the steps with the highest abandonment rates; these represent the biggest opportunities for improvement (and revenue).
- Use one A/B test at a time per funnel to keep results clean.
- Review and refine your funnels regularly as your site evolves. Compare your funnels over time to track their performance and see if your optimization efforts have improved or declined.
Funnels Help You Make Smarter Decisions, Faster
If you’re tired of guessing what’s broken in your customer journey, Heatmap Funnels gives you the clarity to make confident decisions. It’s built for marketers who want to improve results without wasting hours digging through data or running random tests.
👉 Build your first funnel in under 5 minutes, and find your highest impact opportunity today

Dylan AnderPublished August 29, 2025