We Tried 10 Mixpanel Alternatives - Here's #1

Discover the top 10 Mixpanel alternatives to elevate your analytics strategy. Explore options that fit your needs and drive better insights. Read more!

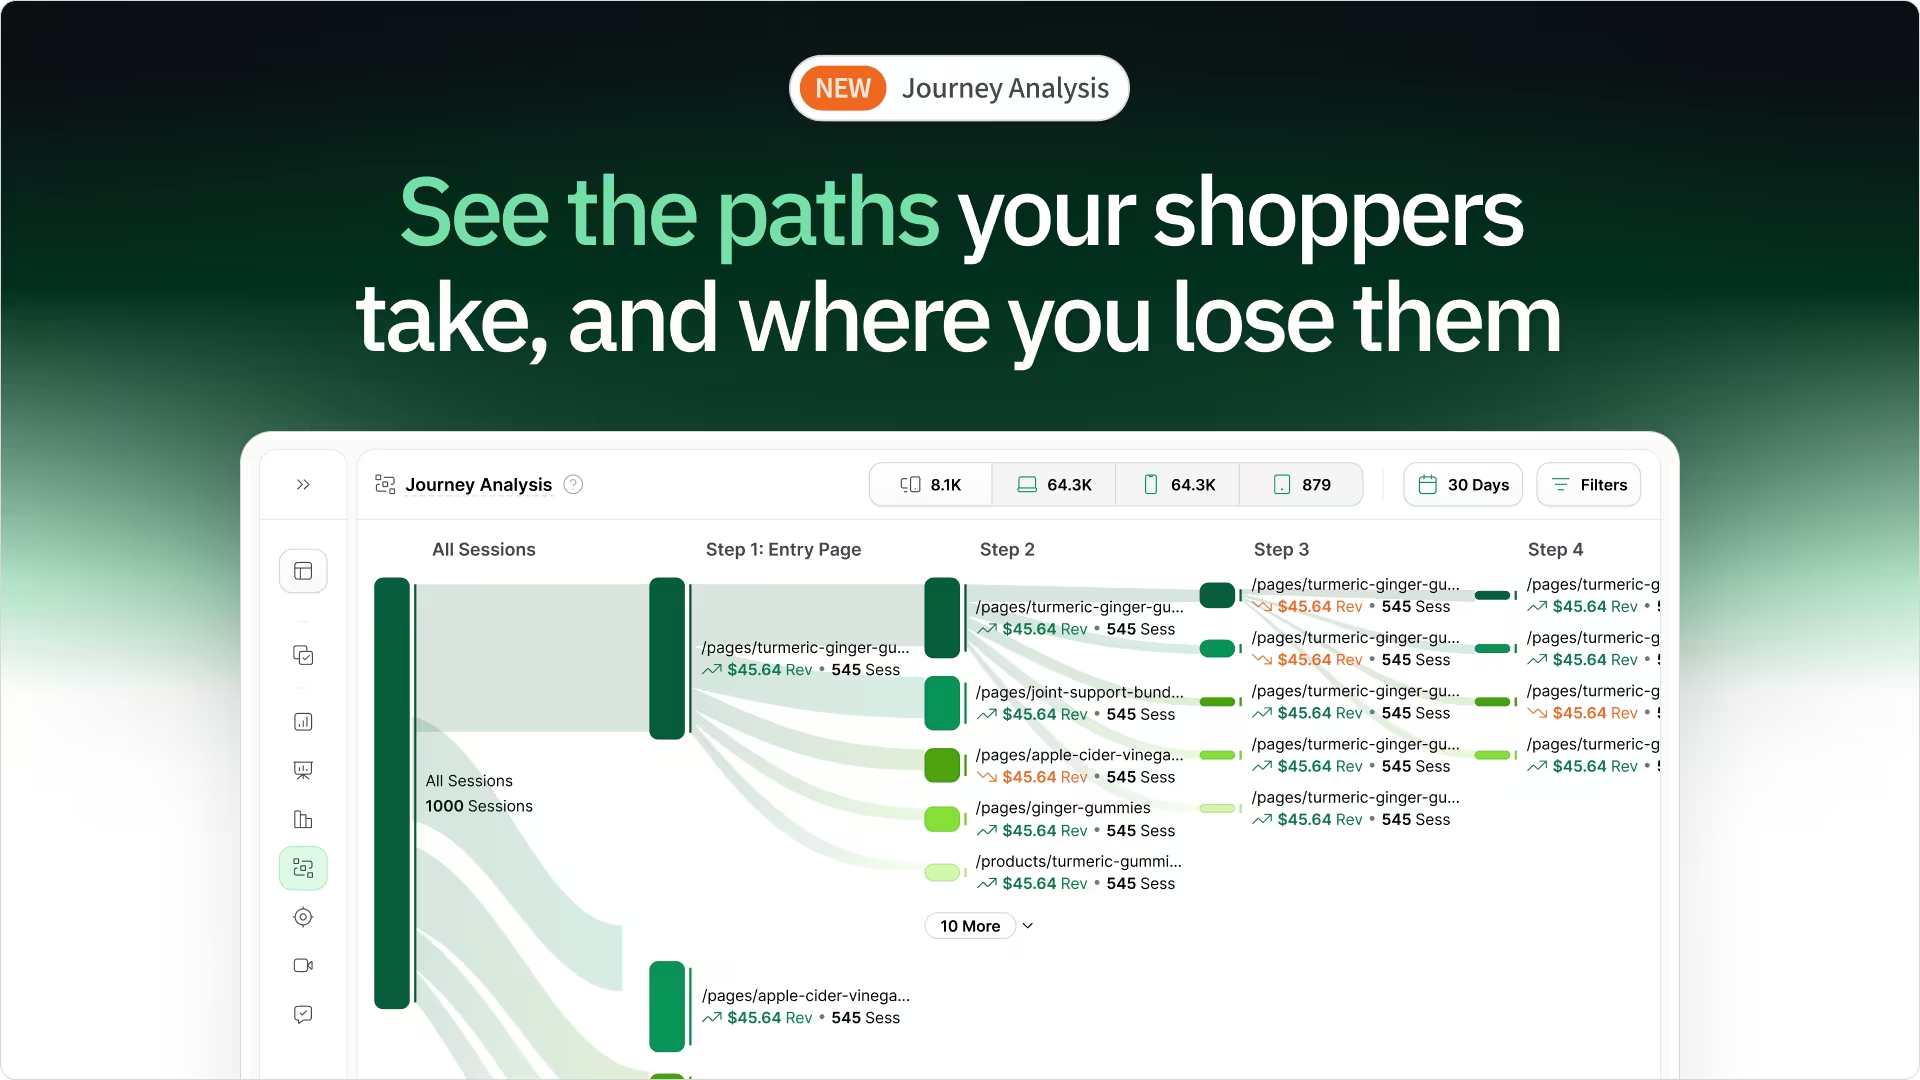
You're tracking clicks, but are those clicks actually driving revenue? Many analytics tools flood you with data but fail to provide clear, actionable insights and direction. You need to know what site changes make a real impact on your bottom line.
TL;DR
- Mixpanel Alternatives: You need an analytics tool that clearly shows how website changes impact revenue, not just clicks.
- What to Look for: Watch out for alternatives with steep learning curves, data management issues, integration challenges, confusing reports, and poor support.
- #1 heatmap.com: This revenue-focused platform, trusted by top eCommerce brands, offers revenue-based heatmaps, AI-powered CRO, and more, starting at $117/month.
- #2 Hotjar: Great for UX insights with heatmaps, recordings, and surveys, but consider potential limitations on recordings and higher pricing for larger sites.
- #3 Fullstory: Offers comprehensive digital experience intelligence, but be aware of the learning curve and potential data accuracy issues.
- #4 Microsoft Clarity: A free tool with session recordings and heatmaps, but the UI can be complex, and some data limitations exist.
- #5 Smartlook: Combines quantitative and qualitative data with session recordings and heatmaps, but some UI/UX improvements are needed.
- #6 Lucky Orange: Prioritizes visual tools like heatmaps and session recordings, but consider data accuracy and potential data overload.
- #7 Mouseflow: Specializes in session replays, heatmaps, and funnels, but some users report missing features and occasional data inaccuracies.
- #8 Glassbox: Provides a holistic view of the customer experience with session replays and AI-powered insights, but session management and UI complexity can be concerns.
- #9 PostHog: An open-source platform with a wide range of features, including session replay and experiments, but be aware of the learning curve and potential UI complexity.
- #10 Optimal Workshop: Focuses on qualitative research with tools like card sorting and tree testing, but consider potential integration issues and software bugs.
- heatmap.com is the Top Choice: If you're looking for a revenue-focused, user-friendly, and affordable analytics platform, heatmap.com is the clear winner. Consider other options if you need broader product analytics or advanced features.
We tested ten Mixpanel alternatives to find the one that cuts through the noise and shows you exactly where your money's coming from. Imagine seeing revenue tied to every click—no more guesswork.
Mixpanel Has its Flaws
We analyzed dozens of Mixpanel reviews on G2, Gartner, Trustpilot, and SoftwareAdvice. Patterns emerged. Users aren't just looking for features; they need solutions to specific problems. You don't want a tool that adds to your workload, right? You want clarity and efficiency.
Here are the issues that kept coming up:
- Confusing Funnel Reports: Several users point out that funnel reports can give inconsistent starting values. One reviewer said, "The funnel report can give different starting values to the same event in a metric report." This leads to data discrepancies and makes it hard to trust the insights.
- API Customization Limitations: Product analysts find the data export API lacks customization. One user stated, "The data export API can be improved by making it customizable." When you need to extract specific data, limited API flexibility slows you down.
- Group Analytics Shortcomings: Group analytics, while powerful, lacks key features. For example, "group analytics -- whilst being really good overall -- is lacking some features (experiment application, lookup tables, etc.) which hinder my workflow somewhat." That's what one review said. This makes it difficult to get a complete picture of user behavior across groups.
- Integration with Other Platforms: Many users struggle to integrate Mixpanel with their existing tech stack. "One of the downsides of Mixpanel is that it can be challenging to integrate with other platforms in our tech stack," a senior customer enablement manager noted. This can lead to data silos and hinder cross-platform analysis.
- Lack of Company-Based Reporting: Some users find it impossible to create reports based on company data. "There also needs to be no way to create reports based on company data, everything is based on the user which essentially makes the product useless for our business," one reviewer explained. This limitation makes Mixpanel less useful for businesses that need to analyze data at a company level.
- Overwhelming Feature Set: While a rich set of features is good, some find Mixpanel too complex. One reviewer mentioned, "While Mixpanel offers a rich array of features, the sheer number of them can sometimes be overwhelming, especially for new users." You want a tool that’s powerful, but also user-friendly.
These are specific complaints that impact real users. When choosing a Mixpanel alternative, you need a tool that addresses these problems. You need clarity, flexibility, and support.
#1) heatmap.com - The Best Mixpanel Alternative on the Market Right Now

Looking for a Mixpanel alternative that actually shows how your website impacts revenue? Look no further, heatmap.com is a revenue-focused analytics platform that provides the insights you need to optimize your site for increased sales.
heatmap.com is trusted by top eCommerce brands to drive serious revenue growth. Want to see how it works? Check out these case studies:
- Obvi: Increased Revenue Per Session by 7.8% with heatmapAI
- JellyBee: Increased their conversion rate by 24.7% and total Annual Revenue over $650,000.
- Cooking Guild: Achieved an incredible increase in Revenue Per Session of nearly 50% on Collections Pages
With heatmap.com, you can see exactly how every element on your website impacts your bottom line. It's like having an AI-powered CRO consultant at your fingertips.
Why teams choose heatmap.com over other analytics tools 🏆

Key Features
- Revenue-Based Heatmaps: See which elements are driving the most revenue and identify areas for improvement.

- AI-powered CRO engine: Get actionable recommendations to optimize your site for increased conversions.
- Site Speed Tracking: Monitor your site's performance and identify opportunities to improve load times.
- Dashboard & Metrics: Track key metrics such as revenue per session, scroll depth, and high-traffic pages.

- Comparison Mode: Compare different cohorts to understand user behavior and segment your audience.
- Rage Click & Top Page Analysis: Identify areas of frustration and optimize your site for a better user experience.
- Safe, Private & Compliant: Your data is safe and secure with heatmap.com's privacy-focused analytics.
- Seamless Integrations: Integrate with all major eCommerce platforms and split-testing tools.

With heatmap, I've been able to figure out what elements actually increase AOV and optimize our landing pages to drive more first purchase profitability, we're up 23% YoY.

Winning Split Tests #1 - Collection Page Optimization. +$71,286 per month in revenue with 97% significance.
1: Download heatmap.com
2: Wait for 5k sessions
3: Reorganize products based on the highest revenue per session from top left to bottom right.

Heatmap is a non-negotiable for all Ecom stores! Read this now!

Don't sleep on heatmap! You could be just a few tweaks away from changing the course of your business.
Pricing: $117 USD/month for annual revenue between $0 – $4.9M
#2) Hotjar

Hotjar is a popular user experience (UX) analytics tool that helps you understand how visitors interact with your website. Unlike Mixpanel, which focuses on broader product analytics, Hotjar specializes in visual insights and user feedback.
Key Features
- Heatmaps: Visualize user behavior with heatmaps that show clicks, scrolls, and mouse movements.
- Recordings: Watch session recordings to see exactly how users interact with your site.
- Surveys & Feedback Polls: Collect user feedback to understand their needs and pain points.
- User Interviews: Conduct user interviews to get in-depth insights into user behavior.
Considerations before going with Hotjar
- Limited Recordings on Paid Plans: Even on paid plans, users report severe limitations on the number of recordings. One reviewer said, "Limitations even on paid plans are very severe. You have very limited visits to record even on paid plans." This can be a problem if you need to analyze a large volume of user sessions.
- Dashboard Clutter: Some users find the dashboard cluttered and difficult to navigate. One review described it as "that one cluttered drawer everyone has at home - full of useful stuff, but you need to rummage." This can make it time-consuming to find the information you need.
- Irrelevant Session Recordings: There have been complaints about irrelevant session recordings, especially in the free version. One user mentioned, "The recorded sessions were always irrelevant or from countries we don't target." This can waste time and resources.
- Website Speed Impact: Some users report that Hotjar can slow down website load times. "Hotjar increases load time of your website, which is a disadvantage," one reviewer stated. This can negatively impact user experience and SEO.
Pricing: Starts at $0 and goes up to $213 based on the number of daily sessions and features included.
Psst. Heatmap is the best Hotjar alternative.
Heatmap.com is the only on-site analytics platform that ties revenue to every pixel on every page of your website. Finally, you can optimize for buyer behavior instead of site traffic.

Spencer Pawliw
@spencepawliw+ $71,286 per month in revenue with 97% significance.
How You Can Do It:
1: Download heatmap.com
2: Wait for 5k sessions
3: Reorganize products based on the highest revenue per session from top left to bottom right.
#3) Fullstory

Fullstory is a digital experience intelligence platform that captures and analyzes user behavior on your website or mobile app. Fullstory provides a comprehensive view of the customer journey, including session replays, heatmaps, and detailed user segmentation. Think of it as a complete "digital experience detective" for your business.
Key Features
- Session Replays: Watch recordings of real user sessions to see exactly how people interact with your site.
- User Segmentation: Create detailed user segments to understand the behavior of specific groups.
- Error Detection & Debugging: Identify and diagnose errors that are impacting user experience.
- Conversion Funnels: Analyze conversion funnels to identify areas for improvement.
Considerations before going with Fullstory
- Steep Learning Curve: Users commonly mention a steep learning curve. One reviewer said, "A bit difficult to level up beyond the introductory level." This means investing time in training to get the most out of it.
- Data Inaccuracy: Some users have reported issues with data governance. One review stated, "TThe funnel report can give different starting values to the same event in a metric report." This can lead to misleading insights.
- Limited Chart Options: A few reviewers found the available chart options to be limited. A user said, "The lack of chart differences available to users..." This can restrict how you visualize customer data.
- Pricing & Billing: Users have criticized Fullstory's pricing and billing practices. One review described them as "Deceptive and punitive pricing and billing structures." It's crucial to understand their pricing model clearly before committing.
Pricing: Starts at $299/month and goes up to $1,000+/month based on the number of sessions, user interaction data history, and features included.
#4) Microsoft Clarity

Microsoft Clarity is a free user behavior analytics tool that helps you understand how people interact with your website. Unlike Mixpanel, which is a paid product with a broader focus on product analytics, Clarity offers session recordings, heatmaps, and insights without any cost or traffic limitations.
Key Features
- Session Recordings: Watch recordings of user sessions to see how people navigate your site.
- Heatmaps: Visualize user behavior with heatmaps that show clicks, scrolls, and mouse movements.
- Insights: Get insights into user behavior patterns, such as rage clicks and dead clicks.
- Integrations: Integrate with Google Analytics to get a complete view of user behavior.
Considerations before going with Microsoft Clarity
- UI Complexity: Some users find the user interface chaotic and difficult to navigate. One reviewer noted, "What I don't really like is the way Microsoft does their UI in general. It's kind of chaotic." This could make it harder to find the information you need.
- Occasional Page Scrolling Issues: One review mentioned occasional issues with the page scrolling to the top on user clicks. This could potentially skew session recording data.
- Limited Chart Customization: Users have pointed out a lack of flexibility in customizing charts and renaming data within events. This might make it harder to tailor reports to specific needs.
- Data Accuracy Concerns: A few reviews mentioned minor data accuracy issues. While generally considered reliable, it's something to keep in mind when analyzing data.
Pricing: It's free, forever.
#5) Smartlook

Smartlook is a product analytics platform that combines quantitative and qualitative data to provide a comprehensive understanding of user behavior. Smartlook offers session recordings, heatmaps, and advanced filtering capabilities to help you identify and analyze user interactions.
Key Features
- Session Recordings: Watch recordings of user sessions to see exactly how people interact with your product.
- Heatmaps: Visualize user behavior with heatmaps that show clicks, scrolls, and mouse movements.
- Events & Funnels: Track events and analyze funnels to understand user journeys and identify areas for improvement.
- Behavior Flows: Visualize how users navigate through your website or app.
Considerations before going with Smartlook
- UI/UX Improvements Needed: Some users find the UI/UX could be more intuitive and straightforward. One reviewer mentioned, "They can improve their UI/UX to make it more easy to use and more straightforward." This could impact ease of use, especially for new users.
- Occasional Bugs & Errors: Users have reported occasional bugs in recordings and funnel reports, along with slowness in fixing issues. One review stated, "Bugs in the recording, bugs in the funnel reports, slow in fixing the issues." This could affect the reliability of data and insights.
- Limited Historical Data on Free Plan: The free plan only offers one month of data retention. One reviewer pointed out, "The downside is that it only keeps a 1-month event tracking record when used for free." This could be a limitation if you need to analyze historical data.
- Heatmap Creation & Duration: Some users find creating heatmaps more difficult compared to other tools, and the heatmaps deactivate automatically after a short time. This could make it less convenient for ongoing analysis.
Pricing: Starts at $0 and goes up to $55/month based on the number of monthly sessions and features included.
#6) Lucky Orange

Lucky Orange is a suite of conversion optimization tools that helps understand user behavior and improve website performance. Lucky Orange prioritizes visual tools like heatmaps, session recordings, and live chat to provide immediate insights into user interactions. It's like having a live view of your website, with tools to understand what's happening right now.
Key Features
- Dynamic Heatmaps: Visualize user behavior with heatmaps that show clicks, scrolls, and mouse movements.
- Session Recordings: Watch recordings of real user sessions to see exactly how people interact with your site.
- Surveys & Announcements: Gather user feedback with surveys and share announcements with your visitors.
- Live Chat: Engage with visitors in real time to provide support and answer questions.
Considerations before going with Lucky Orange
- Data Accuracy Concerns: Some users have reported inconsistencies in data accuracy, particularly with session recordings. One reviewer noted, "Despite persistent issues with website session recordings..." This could impact the reliability of insights.
- Not a Google Analytics Replacement: One review emphasized that Lucky Orange is a complementary tool, not a replacement for Google Analytics. Keep in mind that it may not provide the same depth of data as a dedicated analytics platform.
- Potential for Overwhelming Data: With a wide range of features, some users find it challenging to effectively interpret and sift through the data. One reviewer mentioned, "There is so much information it is often overwhelming." This could require a learning curve to use effectively.
- GA4 Integration Quirks: The automatic connection with GA4 based on the script can be an issue for sites using multiple GA4 scripts, as highlighted in one review. This could lead to unintended data connections.
Pricing: Starts at $0 and goes up to $899/month based on the number of monthly sessions and features included.
#7) Mouseflow

Mouseflow is a behavior web analytics platform that helps understand how users interact with your website. Unlike Mixpanel, which focuses on broader product analytics, Mouseflow specializes in session replays, heatmaps, and funnels to provide a visual representation of user behavior.
Key Features
- Session Replays: Watch recordings of real user sessions to see exactly how people interact with your site.
- Heatmaps: Visualize customer behavior with heatmaps that show clicks, scrolls, and mouse movements.
- Funnels: Analyze conversion funnels to identify areas for improvement and reduce drop-offs.
- Forms Analytics: Track form interactions to understand where users abandon forms and optimize form completion rates.
Considerations before going with Mouseflow
- Missing Features: Some users have reported missing features compared to other analytics tools. One review mentioned, "Advanced tagging features not available." This could be a limitation if you require specific functionalities.
- Recording Issues: Some users have experienced issues with session recordings, such as difficulties with loading recordings due to dynamic CSS. While support can help resolve this, it's something to be aware of.
- Data Inaccuracy: A few reviews mentioned occasional data inaccuracies. One reviewer stated, "The data has some small accuracy issues." It's important to be mindful of this when analyzing data.
- Dashboard Complexity: Some users find the dashboard overwhelming, especially with a large volume of data. One review mentioned, "Too much information could sometimes make it hard to find what you need." This could require a learning curve to navigate effectively.
Pricing: Starts at $39/month and goes up to $259/month based on the number of sessions and features included, with custom pricing for Enterprise plans.
#8) Glassbox

Glassbox is a customer experience analytics platform that helps businesses understand and optimize their digital journeys. The platform provides a more holistic view of the customer experience, including session replays, customer journey mapping, and AI-powered insights.
Key Features
- Session Replay: Watch recordings of real user sessions to see exactly how people interact with your website or app.
- Customer Journey Analytics: Map and analyze customer journeys to identify pain points and areas for improvement.
- AI-Powered Insights: Get automated insights and recommendations to optimize the customer experience.
- Interaction & Heatmaps: Visualize user behavior with heatmaps and interaction maps to understand engagement patterns.
Considerations before going with Glassbox
- Session Management Issues: Some users have reported issues with session management, such as slow loading times and incomplete recordings. One reviewer pinpointed, "The system can be slow at times and you can't find sessions that are older than a year." This could impact the efficiency of session analysis.
- UI Complexity: A few users have found the interface not as intuitive as they expected. One review mentioned, "Filtering seems a bit complex and opaque."
- Data Accuracy: While generally considered accurate, some users have raised questions about data accuracy, especially when comparing Glassbox data with Google Analytics. One reviewer stated, "Data accuracy is always the biggest topic when discussing about Glassbox." It's important to be aware of potential discrepancies.
- Missing Features: Some users have pointed out missing features or desired improvements. One review mentioned, "It would be great if there were more training webinars and sharing the roadmap." This suggests that the platform may not have all the functionalities that some users require.
Pricing: Glassbox offers customized pricing based on your specific needs and requirements. Contact their sales team for a quote.
#9) PostHog

PostHog is an open-source product analytics platform that provides a comprehensive suite of tools for analyzing user behavior, running experiments, and managing feature flags. The platform offers a broader range of features than Mixpanel, including session replay, heatmaps, and even a product roadmap tool.
Key Features
- Product Analytics: Track user behavior with event-based analytics, cohorts, and conversion funnels.
- Session Replay: Watch recordings of real user sessions to see exactly how people interact with your product.
- Experiments: Run A/B tests and other experiments to optimize your product and improve user experience.
- Feature Flags: Manage feature releases and rollouts with feature flags.
Considerations before going with PostHog
- Learning Curve: Some users find the platform overwhelming at first due to the extensive feature set. One reviewer mentioned, "The main challenge with PostHog lies in its initial learning curve." This could require some time to get familiar with all the functionalities.
- UI Complexity: A few users have commented on the UI not being as intuitive as they hoped. One review stated, "I'm not really a technical person, so I feel like I have to learn a lot more before I can understand the data." This could impact ease of use for non-technical users.
- Missing Features: While PostHog offers a wide range of features, some users have pointed out missing features or areas for improvement. One reviewer mentioned, "The documentation could be clearer in some areas." This suggests that the platform may not have all the functionalities that some users require.
- Limited Retention on Free Plan: The free plan has a limited data retention period. One reviewer noted, "Its retention period in some modules goes as low as 1 month in the free tier." This could be a limitation if you need to analyze historical data.
Pricing: Starts at $0 with a generous free tier, and offers usage-based pricing for additional features and usage.
#10) Optimal Workshop

Optimal Workshop is a suite of user research tools designed to gather insights and make data-driven decisions about your product's design. Unlike Mixpanel, which focuses on quantitative product analytics, Optimal Workshop specializes in qualitative research methods like card sorting, tree testing, and first-click testing. It's like having a focus group and a usability lab at your fingertips, allowing you to understand how users perceive and interact with your designs.
Key Features
- Card Sorting: Understand how users categorize information and create intuitive navigation structures.
- Tree Testing: Test the findability of information within your website's hierarchy.
- First-Click Testing: Identify where users click first on a page to optimize design and improve user experience.
- Prototype Testing: Test interactive prototypes to gather feedback and identify usability issues early on.
Considerations before going with Optimal Workshop
- Integration Issues: Some users have reported difficulties when integrating Optimal Workshop with other tools in their workflow. One reviewer mentioned, "The Figma prototype integration is a welcome addition but our requirements made it quite difficult to get it to work in practice."
- Software Bugs: A few users have encountered software bugs, particularly with the Figma integration. One review stated, "Figma integration has a few bugs as animations can cause issues with the behavior of prototype tracking." This could affect the reliability of your A/B testing results.
- Limited Screening Questions: One reviewer pointed out a limitation on the number of screening questions, which could impact the ability to target specific user groups. This could be a constraint if you need to recruit very specific participants for your studies.
- Aggregating User Answers: Another reviewer mentioned difficulties with aggregating user answers for post-test questions. This could make it more time-consuming to analyze qualitative feedback.
Pricing: Starts at $107/month for individuals, with custom pricing for Teams and Enterprise plans.
heatmap.com is the Mixpanel Alternative of Choice
heatmap.com stands out as the best Mixpanel alternative for businesses focused on revenue growth. It offers a unique combination of features, ease of use, and affordability that makes it a clear winner.
- Revenue-Focused Analytics: Unlike Mixpanel, heatmap.com directly ties revenue to user interactions, providing clear insights into what drives sales.
- Intuitive Interface: heatmap.com offers a user-friendly interface that's easy to navigate and understand, even for non-technical users.
- Easy Setup: Get started quickly with heatmap.com's simple installation process.
- Affordable Pricing: heatmap.com offers competitive pricing plans that are more affordable than Mixpanel, especially for businesses with high traffic.
- Excellent Customer Support: Get responsive and helpful support from heatmap.com's dedicated customer support team.
If you're looking for a revenue-focused, user-friendly, and affordable analytics platform with excellent customer support, then heatmap.com is the perfect choice. However, if you need a tool with broader product analytics capabilities or advanced features like group analytics, then PostHog or Fullstory might be a better fit.
Try heatmap.com | Your eCommerce site will thank you (so will your wallet)
We are the only onsite analytics platform that tells you how to make more money - down to the pixel. Trusted by 1000+ eCommerce brands.
Ashvin Melwani
@ashvinmelwaniWith heatmap, I've been able to figure out what elements actually increase AOV and optimize our landing pages to drive more first purchase profitability, we're up 23% YoY.

How You Can Do It:
1: Download heatmap
2: Wait for 5k sessions
3: Reorganize products based on the highest revenue per session from top left to bottom right.

Founder of heatmap, SplitTesting.com, and multiple ecommerce brands. Lifelong optimizer, CRO-lover, and data nerd.


You made it all the way down here?
Might as well give us a shot, right? It'll change the way you approach CRO. We promise. In fact, our friend Nate over at Original Grain used element-level revenue data from heatmap to identify high-impact areas of his website to test, resulting in a 17% lift in Revenue per Session while scaling site traffic by 43%. Be like Nate. Try heatmap today.
