A rapidly growing UK fashion brand, known for its extensive collections, faced a common issue in online retail: customers were often frustrated by lengthy product searches, only to find that items were out of stock when they reached the product page (PDP). While a filter existed at the top of the collection list (CLL), it wasn’t being fully utilized due to its placement. Users often scrolled down, found items, and had to navigate back up to apply the filter - adding friction and lowering conversion rates.
That Works Agency, a Shopify and Shopify Plus specialist, partnered with heatmap to analyze this friction point and uncover two critical insights:
- High Revenue from Filter Users
By leveraging heatmap’s revenue tracking capabilities, the team discovered that users who engaged with the filter generated three times more revenue than those who didn’t. This correlation with average order values (AOV) across categories highlighted a valuable, underutilized user behavior.
- Accessibility is Key
heatmap’s scroll-depth analysis and session recordings confirmed that most users accessed the filter only when returning to the top of the CLL after extensive scrolling, a clear pain point that led to abandoned searches.
With these insights, That Works tested whether making the filter more visible and accessible would increase conversions. They ran an A/B test, enlarging the filter and making it sticky so it stayed in view as users scrolled.
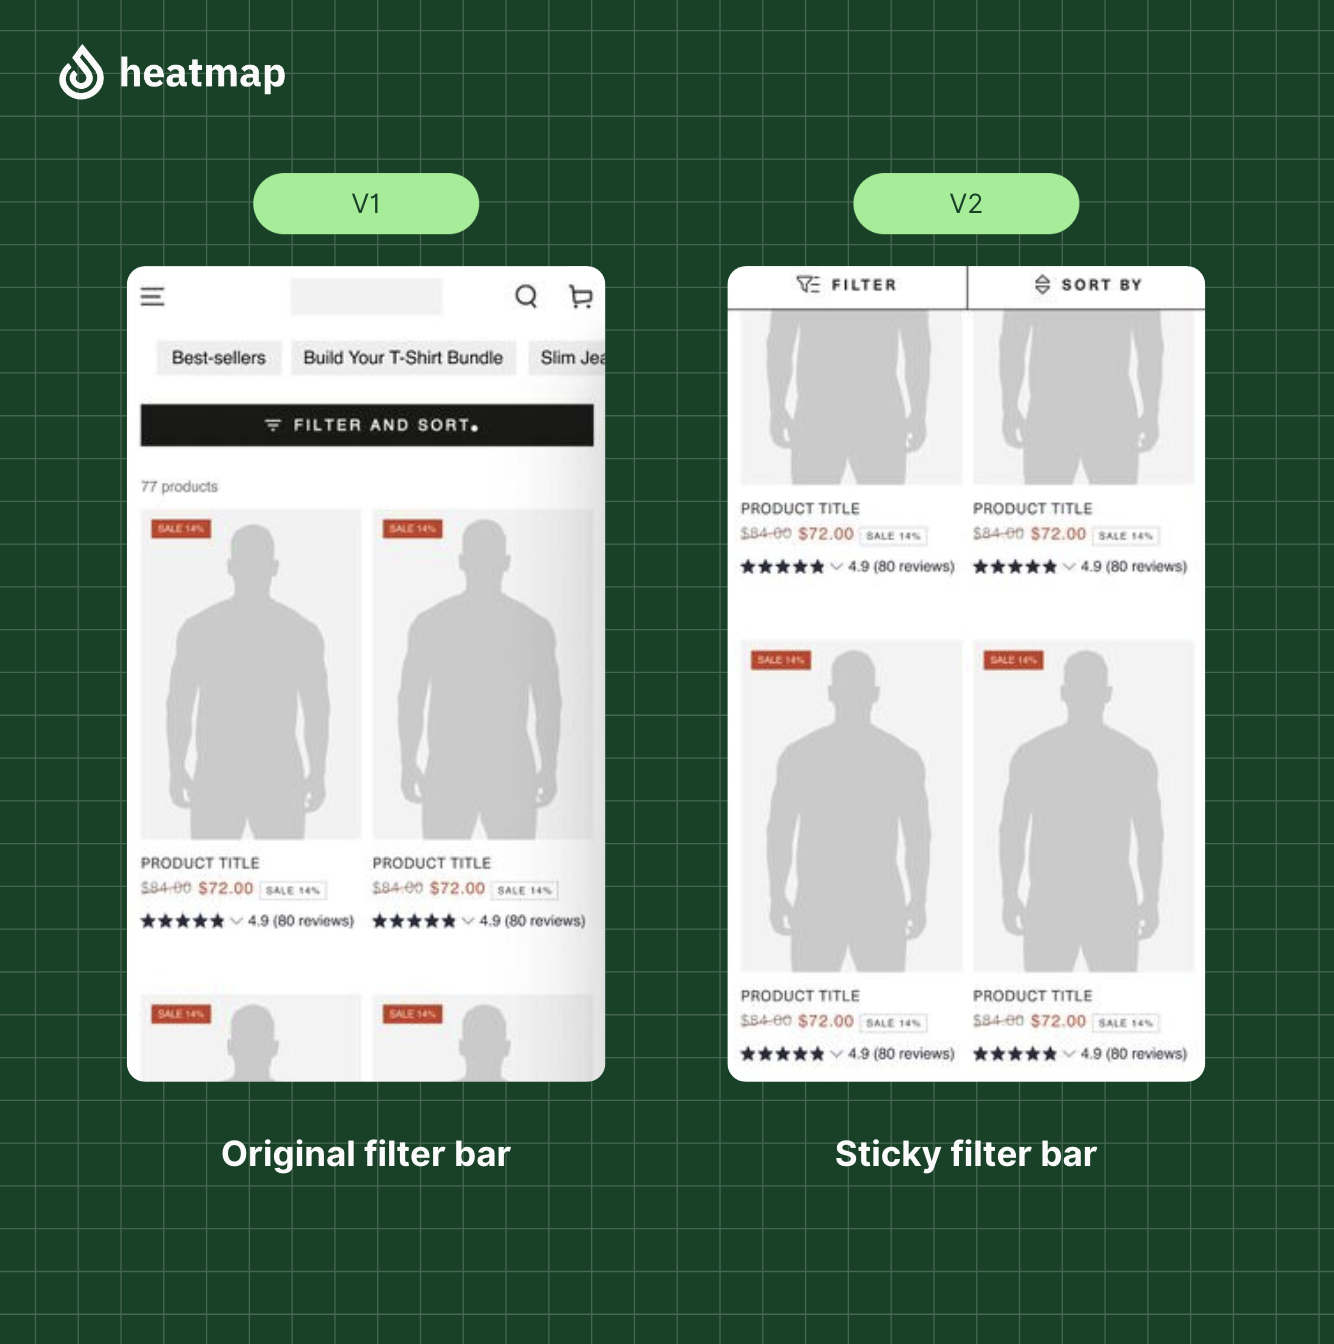
The test yielded impressive gains across multiple metrics:
- +4.22% increase in conversion rate
- +13.07% increase in revenue per visitor
- +14.19% increase in average basket size
- +34.48% increase in filter usage
These metrics translated to +13% increase in additional revenue, proving the impact of optimizing the filter experience on the brand’s bottom line.
Key Takeaway: Filter Engagement Drives Revenue
These metrics translated to +13% increase in additional revenue, proving the impact of optimizing the filter experience on the brand’s bottom line.
This case illustrates the power of granular, revenue linked behavioral insights. By making filters more accessible, That Works Agency turned a small design change into a major revenue driving improvement. Without heatmap’s ability to connect user actions with revenue data, this opportunity might have remained hidden.