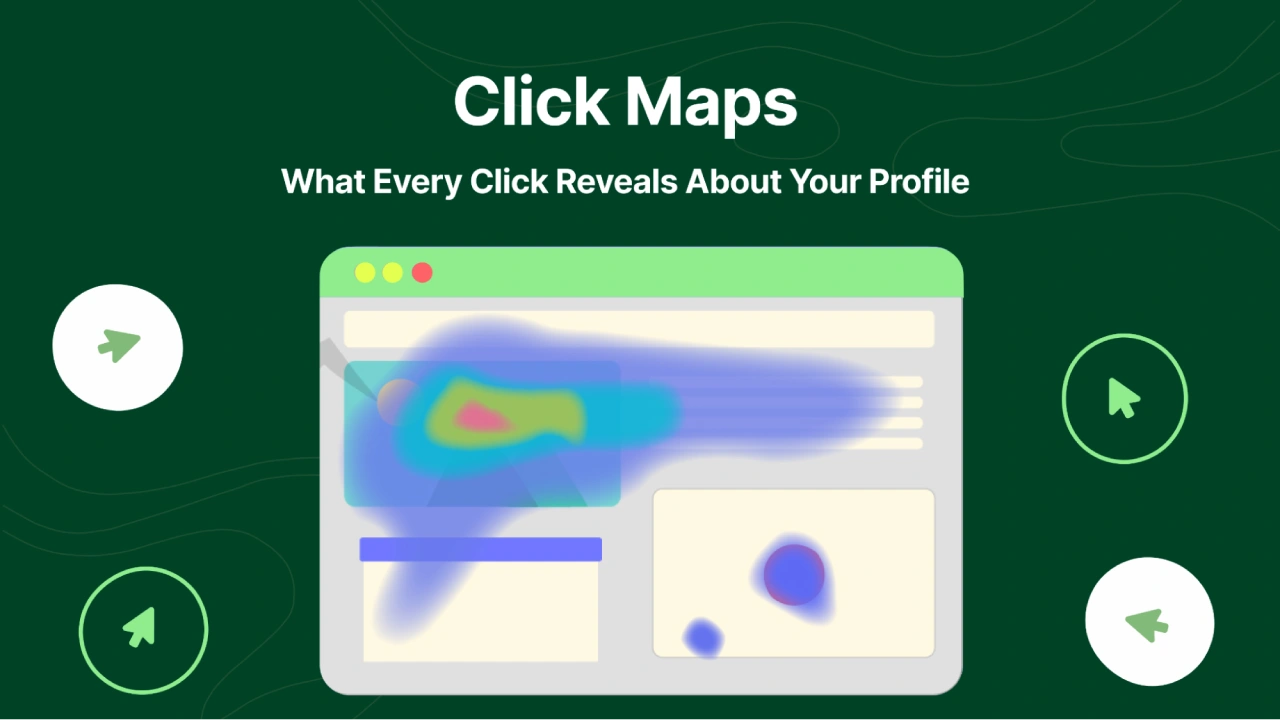
Click Maps: What Every Click Reveals About Your Profits

Learn how to enhance your website's effectiveness using click maps. Discover actionable tips to analyze user behavior and improve conversions.
Ever wonder what happens after a user clicks on your site? Each click is a clue. But are they leading you to treasure or a dead end? Many chase clicks, thinking it's the whole story. It's not. Clicks without context? That's like reading a map without knowing where you're going. We'll show you how to turn those clicks into real profit.
Here's what we'll cover:
- What click maps are and how they differ from other tracking tools.
- Why click maps alone don't give you the full picture.
- How to use click data effectively, with real-world examples.
Let's find out this and more.
TL;DR: Click Maps and Your Profits
- What is a Click Map: Click maps visually show where users click, revealing engagement hotspots but not the reasons behind the clicks.
- Click Maps vs. Scroll Maps vs. Heatmaps: Click maps pinpoint click locations, scroll maps show scroll depth, and heatmaps offer a broad view of user behavior.
- Why Click Maps Are Important for Your Website: They highlight high-engagement areas and ignored elements. This helps optimize button and link placement.
- How to Use Click Maps on Your Website: Interpret click metrics like click frequency, rage clicks, and conversion clicks to understand user actions.
- But, Click Maps Don’t Provide the Complete Picture: Clicks alone are misleading; pair them with revenue metrics like RPS and conversion rates for true insights.
- heatmap.com Helps You Find Out the WHY Behind Clicks & Revenue Impact: Use heatmap.com to connect clicks to revenue, get AI insights, and optimize based on real-world data and case studies.
What is a Click Map?
A click map visually represents where users click on your website. Think of it as a heat map, but focused solely on clicks. It shows you which page elements get the most interaction. Red spots mean high activity, while blue or green areas indicate fewer clicks. This gives you a quick snapshot of user engagement.
Why use click maps? They help identify if people are interacting with your site as intended. If a button meant for high conversions gets few clicks, you know something's off. Maybe the placement is poor, or the call-to-action is weak. You can spot these issues fast.
But, a click map alone is just that—a map. It tells you where users click, not why. This distinction is crucial. You might see high clicks on a certain image, but is it because users are interested or because they're confused? We'll get into that more later.
Click Maps vs. Scroll Maps vs. Heatmaps
You want to know what users do on your site. Each map type gives a different view. Think of them as tools in a kit—each serves a specific purpose.
- Click Maps:
- Show where users click.
- Reveals engagement hotspots.
- Helps identify the performance of clickable elements.
- Great for checking if buttons and links work.
- Scroll Maps:

- Show how far users scroll.
- Indicates content engagement and drop-off points.
- Helps optimize page length and content placement.
- See where users lose interest.
- Heatmaps:

- Show overall user activity, including mouse movements and clicks.
- Provides a broader view of user behavior.
- Helps understand general user interaction patterns.
Here's a quick table to make it clearer:
Click maps are great for seeing where users click. Scroll maps show how far they go. Heatmaps give you the big picture. Each has its place. For real insight, you might use all three.
For example, a click map might show high clicks on a product image. A scroll map could show where users drop off before the "Add to Cart" button. A heatmap might reveal users are moving their mouse erratically near a confusing navigation element. Use these to find the real problems.
Why Click Maps Are Important for Your Website
Click maps provide a clear view of user interaction by showing where users click and what they ignore. This data helps identify areas with high engagement and areas that need attention.
Why does this matter? It allows you to optimize your site effectively. You can make sure key elements get attention. A button with low clicks? Change it. A link with high clicks? Make it more prominent. This direct feedback helps improve user experience.
Click maps help you:
- Find high-engagement areas:
- Identify which sections or elements of your website attract the most user interaction.
- Pinpoint popular content, buttons, and links that resonate with your audience.
- Understand which parts of your page draw the most attention, allowing you to highlight key information.
- Spot ignored elements:
- Discover areas of your website that receive little to no user interaction.
- Recognize elements that may be overlooked due to poor placement, design, or messaging.
- Identify potential usability issues that prevent users from engaging with certain parts of your site.
- Optimize button and link placement:
- Determine the most effective locations for calls to action, navigation links, and other interactive elements.
- Test different placements to see which ones generate the highest click-through rates.
- Ensure that important links and buttons are easily visible and accessible to users.
- Improve overall user experience:
- Gain insights into how users navigate and interact with your website.
- Identify and address usability issues that may be hindering user engagement.
- Create a more intuitive and user-friendly experience that encourages conversions.
Click maps are great, but they don’t provide the full picture. They show where users click, not why. Clicks alone don’t reveal intent or conversion potential.
Setting Up Heatmaps for Click Analysis with heatmap.com
Heatmaps, including click maps, are accessed through a single setup on heatmap.com. Here's how to focus on click data:
- Login: Begin by logging into your heatmap.com account. You will see a list of all your website pages.
- Select a Page: Choose the page you want to analyze for click activity. Allow a moment for data to populate.

- View Heatmaps: You will see a comprehensive heatmap showing user interactions, including clicks.

- Pay close attention to "hotspots" where clicks cluster. These indicate areas of high user engagement.
- Use auto-rectangles to identify important elements marked by heatmap.com's algorithm.

- Create custom boxes to analyze specific groups of elements, such as product listings.

- Open the data table to see detailed click metrics, including click frequency, conversion, and revenue.

- Filter data by user segments (e.g., purchasers, non-purchasers) to understand how different groups interact with click elements.

- Identify Rage Clicks:
- Look for areas with rapid, repeated clicks, which signal user frustration.
- Use this data to fix broken links, confusing elements, or slow-loading pages.
- Analyze Conversion Clicks:
- Focus on clicks that lead to desired actions, like purchases or form submissions.
- Optimize elements with high conversion click rates.
- Combine with Revenue Data:
- Use heatmap.com to correlate click data with revenue metrics like Revenue Per Session (RPS).
- This helps you understand the financial impact of clicks, not just the volume.
- AI Insights:
- Leverage heatmap.com AI to get recommendations on how to improve click driven elements.
By using heatmap.com, you can quickly identify high-engagement click areas and understand how clicks translate to revenue.
Understanding Click Maps: Key Metrics and What They Reveal About User Behavior
You have click data. Now what? You need to know how to read it. You need to know what it means. Let's break down the key click metrics.
But, Click Maps Don’t Provide the Complete Picture
Click maps show where users interact — not why.
A high number of clicks can mean interest, but it can also signal confusion or frustration (rage clicks, anyone?).
Take a look at this tweet by Andrei Breha highlighting how heatmapAI's "Revenue Per Session" metric tells you the full story behind user clicks, informing you on which clicked products generate the most revenue, so you can move them higher 😉.
So while 3,334 clicks might look great, they don’t tell you if those clicks made money. It's the other metric that inform you on that:
- 115 purchases
- $19,405 in revenue
- 3.45% conversion rate
- Revenue per click (RPC): $5.82
Solid numbers. A 3.45% conversion rate is actually better than the eCommerce average. But if you're only looking at clicks, you'd never know that.
The takeaway: clicks ≠ value. You need to overlay click data with conversion rate, revenue per click, and revenue per session. That’s how you identify what’s driving the bottom line.
Move high-RPS products higher on the page. Optimize based on earnings, not just engagement heat. That’s where the real growth comes from.
heatmap.com Helps You Find Out the Revenue Impact Behind Clicks

You need more than just clicks. You need to know the why. heatmap.com gives you that. It connects clicks to revenue. It shows you what actions drive sales. It helps you see the real impact of every click.
- Obvi Increased Revenue Per Session by 7.8% with heatmap.com
- Obvi used heatmap.com to analyze user behavior and maximize revenue from their landing pages.
- heatmap.com's AI provided recommendations, like moving the CTA button above the fold.
- Results: +4.69% conversion rate, +7.81% revenue per session.
- This single recommendation added $2.5 million in revenue.

- That Works Agency Achieved a +13% Increase in Revenue Per Session for a Growing UK Fashion Brand
- The fashion brand faced customer frustration due to out-of-stock items.
- heatmap.com showed that users who used filters generated three times more revenue.
- By making filters more visible, they saw a +13% increase in revenue per session.
- This shows the value of revenue linked behavioral insights.

- JellyBee Increased Conversion Rate 24.7% with heatmap.comAI
- JellyBee, a supplement brand, wanted to scale without losing profitability.
- heatmap.comAI recommendation was to add a human element to their hero image.
- Results: +24.7% conversion rate, +31% ROAS, +14.4% revenue per session.
- This resulted in over $650,000 in additional revenue for the year.

A click map software like heatmap.com provides the tools you need to see the full picture.
Key Features
- Revenue-Based Heatmaps: View revenue tied to every click. See the financial impact of user interactions. Custom filters let you analyze click map data by behavior, AOV, and traffic source. This feature allows you to see the true value of each click.

- Interactive Scrollmaps: See where website visitors lose interest and revenue potential drops. The insights go beyond typical user engagement data.
- AI Insights: An AI prediction engine gives you actionable recommendation to optimize your mobile homepage, collection page, and product display pages (PDP) for profitability. It uses extensive ecommerce data to guide you.

- Screen Recordings: Watch anonymized visitor interactions. See what works and what needs fixing. Uncover high-value behaviors that drive conversions. This helps you understand the "why" behind the clicks.
Frequently Asked Questions
What are click maps?
Click maps visually represent where users click on your website. They show which page elements get the most interaction. Red spots indicate high activity, while blue or green areas show fewer clicks. This helps you understand user engagement and identify areas for optimization.
What is the difference between a heatmap and a click map?
A click map focuses solely on where users click. It highlights specific elements that users interact with. A heatmap, on the other hand, shows overall user activity, including mouse movements, scrolling, and clicks. It provides a broader view of user behavior and engagement patterns.
How to use click maps?
To use click maps effectively, start by identifying high-engagement areas and spotting ignored elements. Optimize button and link placement based on click data. Pair click map reports with revenue metrics, like revenue per session (RPS), to understand the true impact of user interactions. Use heatmap.com to get deeper insights and AI-driven recommendations.
Try heatmap.com | Your eCommerce site will thank you (so will your wallet)
We are the only onsite analytics platform that tells you how to make more money - down to the pixel. Trusted by 1000+ eCommerce brands.

Ashvin Melwani
@ashvinmelwaniWith heatmap, I've been able to figure out what elements actually increase AOV and optimize our landing pages to drive more first purchase profitability, we're up 23% YoY.

How You Can Do It:
1: Download heatmap
2: Wait for 5k sessions
3: Reorganize products based on the highest revenue per session from top left to bottom right.

Founder of heatmap, SplitTesting.com, and multiple ecommerce brands. Lifelong optimizer, CRO-lover, and data nerd.


You made it all the way down here?
Might as well give us a shot, right? It'll change the way you approach CRO. We promise. In fact, our friend Nate over at Original Grain used element-level revenue data from heatmap to identify high-impact areas of his website to test, resulting in a 17% lift in Revenue per Session while scaling site traffic by 43%. Be like Nate. Try heatmap today.
