Heatmap, Rebuilt for Speed and Revenue

Discover the rebuilt Heatmap platform designed to help teams move from data to action faster. The update introduces a faster UI, AI-powered insights, Slack and email integrations, improved collaboration, and new tools like Journey Analysis, Custom Events, and Popup Surveys — all built to uncover revenue opportunities and reduce optimization friction.

New UI. Smarter insights. Less friction. More profit.
Heatmap has evolved.
Over the past year, we’ve expanded how ecommerce brands understand on-site behavior. Now, we’ve rebuilt the experience around a single principle:
Insight should lead to action, immediately.
This isn’t a redesign.
It’s a structural upgrade, a more intelligent platform, a faster path to clarity, and a tighter connection between behavior and revenue.
Across the board, we’ve focused on:
- Reducing friction
- Increasing speed to insight
- Expanding where insights surface (email, Slack, in-app)
- Layering in qualitative intelligence
- Improving reporting and collaboration
- Strengthening retention and re-engagement loops
This is the most cohesive version of Heatmap we’ve ever built.
Here’s what’s new.
A Faster, More Intentional Heatmap Experience
The new Heatmap UI is built for clarity.
From the moment you load a report, the experience is streamlined to help you understand performance faster, without second-guessing metrics or navigating unnecessary layers.
A Smarter Heatmap Loader
We redesigned the loading experience to clearly communicate progress while your data renders.
It’s a subtle change, but an important one.
When analyzing performance, uncertainty creates hesitation. The new loader reinforces forward movement, giving you visual confirmation that your insights are processing in real time.
Perceived speed shapes decision confidence.
Now the experience feels as responsive as the data behind it.
Insights That Drive Re-Engagement
Optimization doesn’t begin and end inside a dashboard.
But meaningful action should.
That’s why we expanded how and where insights surface, while keeping execution anchored inside Heatmap.
Weekly & Monthly AI Summaries
Our AI-powered performance summaries deliver key revenue and engagement shifts directly to your inbox.
Instead of logging in and asking:
- What changed?
- Where are we losing revenue?
- What deserves attention this week?
You’ll see:
- Behavior shifts across key segments
- Revenue-impacting interactions
- High-leverage opportunities
- AI-generated recommendations on what to test next
The email gives you the signal. The platform gives you the leverage.
Each summary links directly into the relevant heatmaps, journeys, and reports, so you can move from awareness to execution in seconds.
For founders, this ensures nothing meaningful slips through the cracks.
For growth teams, it establishes a consistent optimization cadence, insight triggers action, and action happens inside the platform.
Heatmap becomes part of your weekly operating rhythm.
Collaboration, Without Friction
Modern optimization is collaborative by nature, spanning marketing, design, product, and leadership.
The new Heatmap experience makes that collaboration seamless.
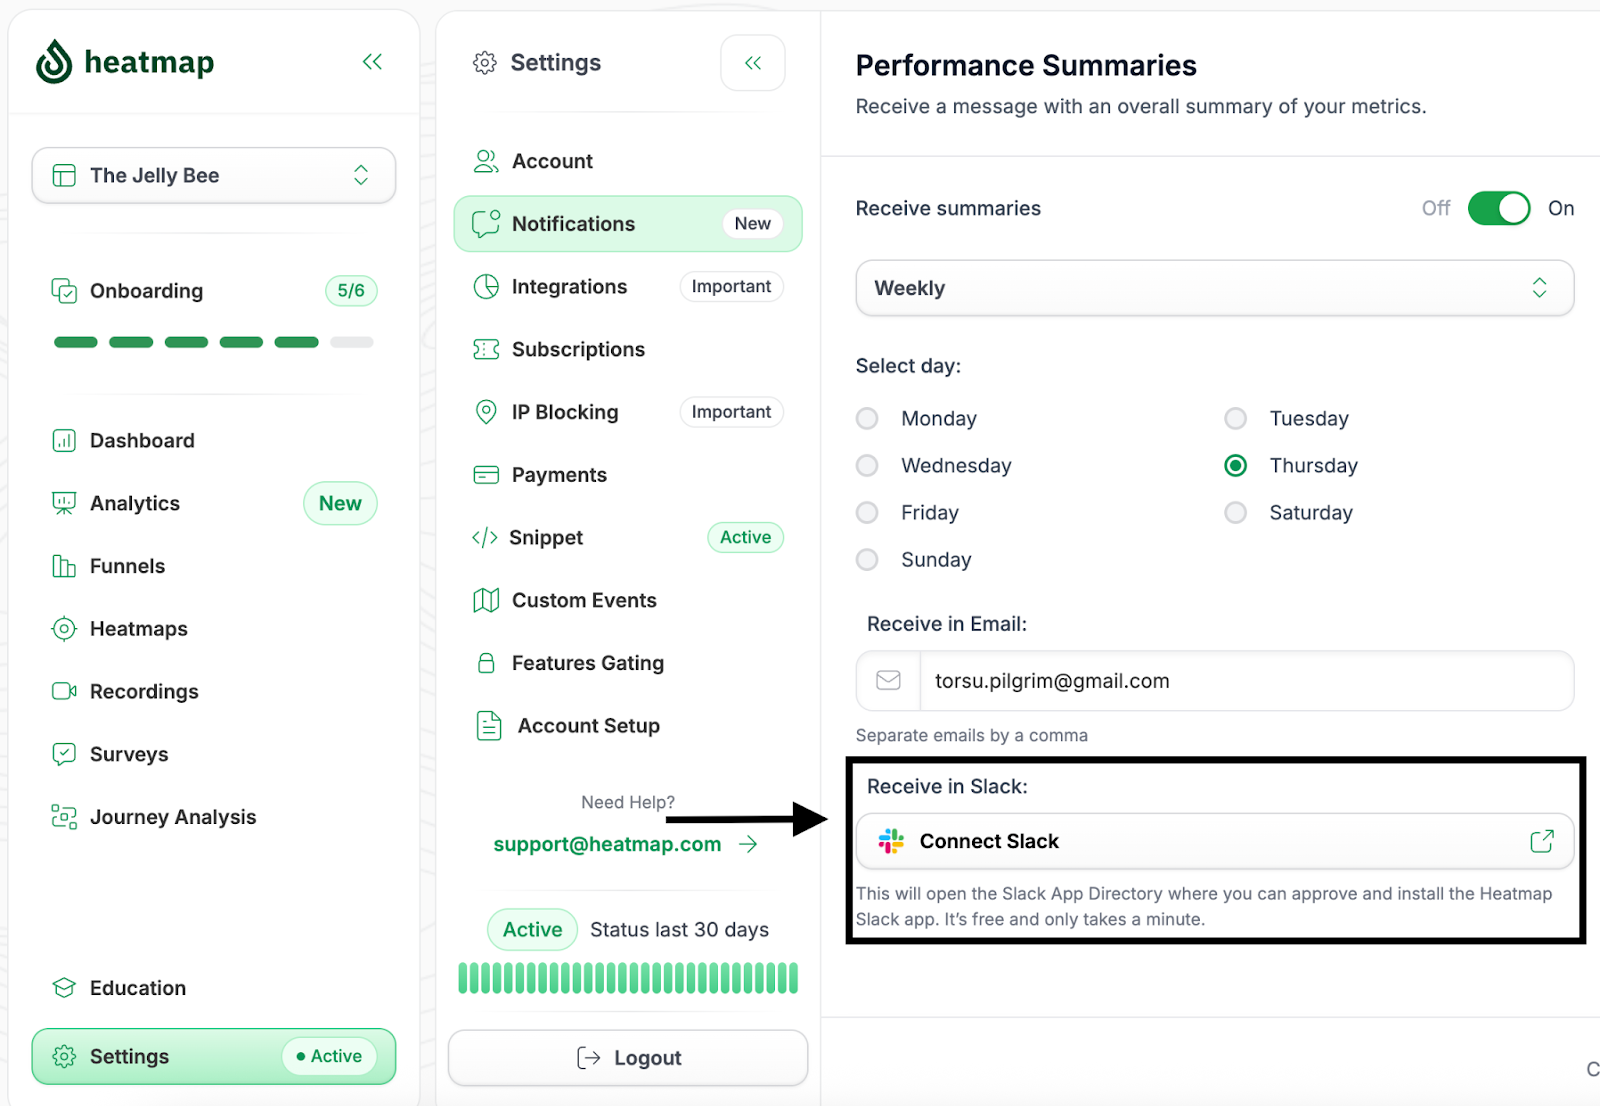
Slack Integration
Send real-time notifications, summaries, and insights directly into Slack.
No more waiting for reports.
No more internal bottlenecks.
Performance data surfaces where your team already communicates, accelerating decision cycles and increasing accountability.
One-Click Chart Exports
Export analytics charts instantly as high-quality JPGs for decks, strategy reviews, or executive updates.
No screenshots. No formatting issues. No wasted time.
Small efficiencies compound, especially when reporting is frequent.

Reduced Friction Across the Platform
Speed isn’t just about load time. It’s about mental clarity.
We refined the interface to reduce friction at every step.
Context-Aware Tooltips
Every key metric now includes clear, just-in-time explanations, so you always understand:
- What you’re seeing
- What each metric means
- Why it matters
- How it’s calculated
For new Heatmap users, this reduces onboarding friction.
For advanced Heatmap users, it speeds up decision-making.
In-App Notifications
Important updates and insight alerts now appear contextually inside the platform.
No workflow disruption.
No unnecessary redirects.
No missed updates.
Embedded Support
Questions shouldn’t slow you down.
Support is now integrated directly into Heatmap. You can now start a conversation, submit a ticket, or escalate without leaving the platform.
No switching tabs. No hunting for help docs.
Beyond Clicks: A More Complete View of Behavior
The new Heatmap experience goes beyond traditional click visualization.
Alongside the new UI, we’ve released powerful features that expand how you understand user behavior, connecting what shoppers do, why they do it, and how it impacts revenue.
These will be explored in more depth individually in the coming weeks, but they’re already live and fully integrated into the new experience.
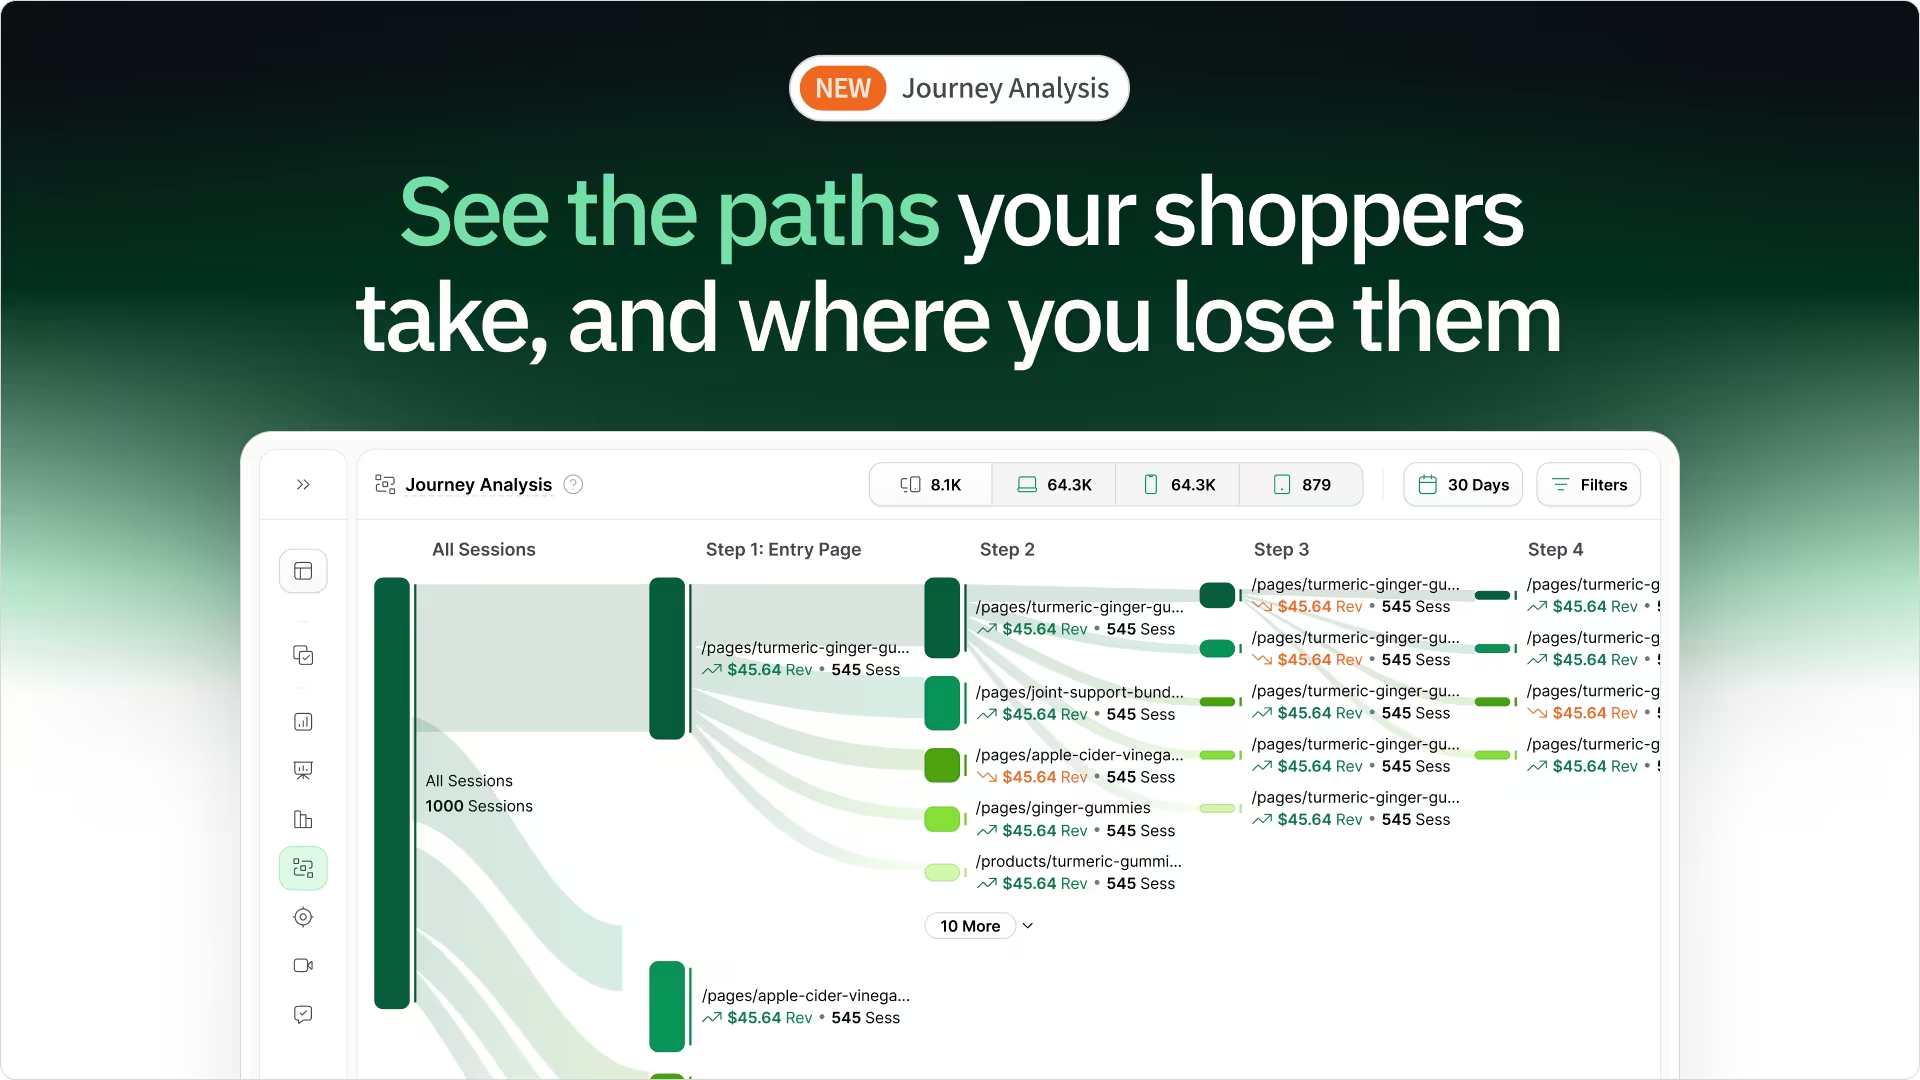
Journey Analysis: Optimize Paths, Not Pages
Pages don’t convert.
Journeys do.
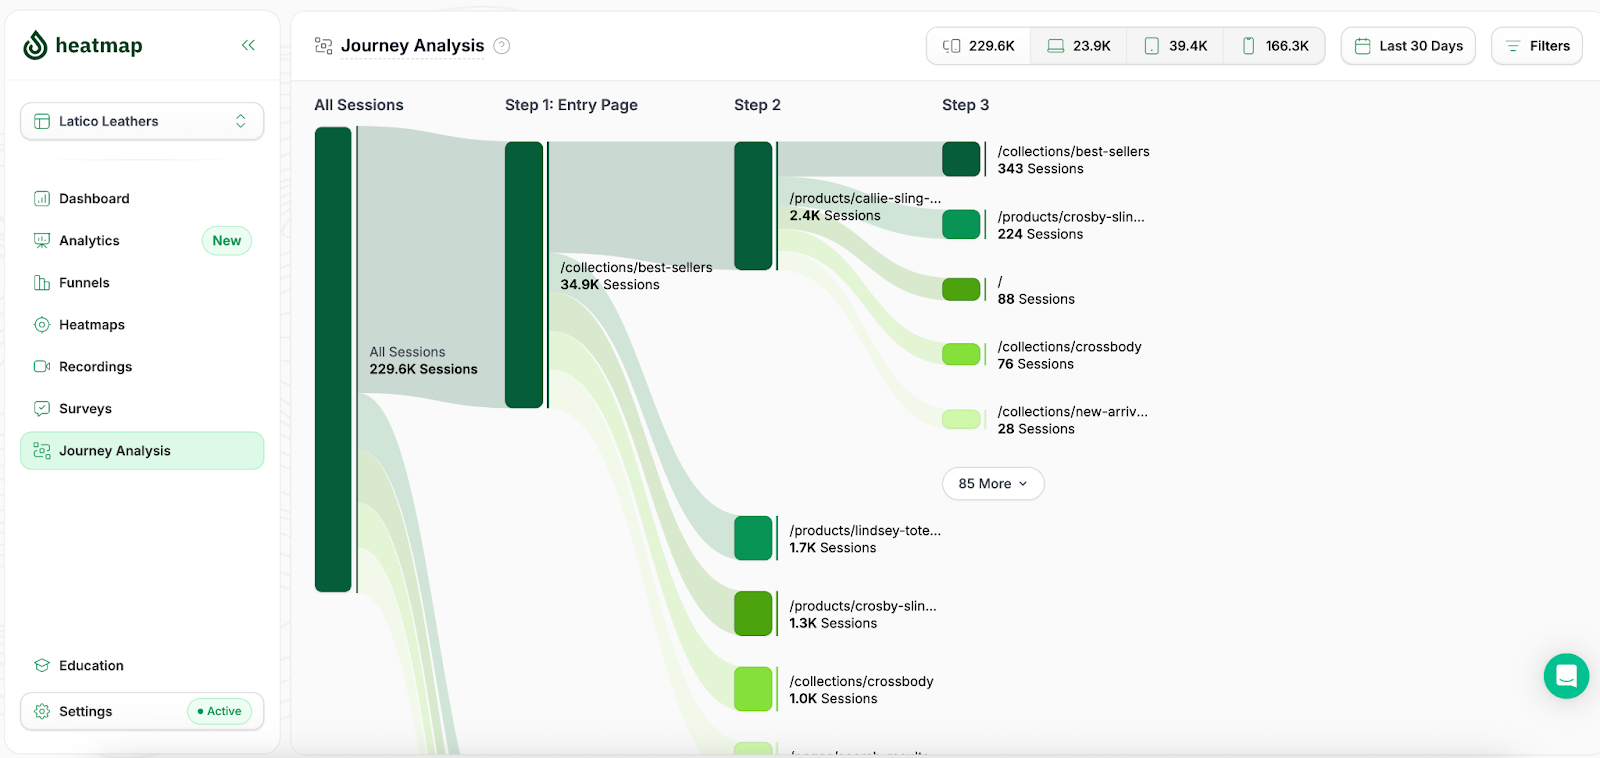
Journey Analysis reveals how shoppers actually move through your site, from entry to purchase, so you can understand not just what happened, but how it happened.
Instead of looking at isolated pages, you see:
- Entry paths
- Page-to-page progression
- Funnel drop-off
- Conversion-driving sequences
For ecommerce brands, this changes how you optimize.
You can identify:
- Which paths produce the highest Revenue Per Session
- Where high-intent shoppers hesitate
- Which sequences correlate with higher AOV
- Where momentum breaks before checkout
Optimization becomes path-based, not page-based.
Instead of asking, “How is this page performing?”
You can ask, “Which journey produces the most revenue, and how do we send more shoppers through it?”
That’s a strategic advantage.
(We’ll be diving deeper into Journey Analysis in an upcoming release.)
Custom Events: Track Intent, Not Just Traffic
Standard analytics track pageviews.
Custom Events track intent.
Define and measure the specific interactions that matter most to your business and see how they influence conversions and revenue.
For example:
- Clicking a size guide
- Interacting with a bundle builder
- Engaging with UGC
- Using financing options
- Opening shipping details
- Starting a quiz
Once live, you can:
- Confirm event firing in real time
- Segment shoppers based on behavioral triggers
- Analyze how those behaviors impact Revenue Per Session
This unlocks a deeper layer of optimization.
Are shoppers who interact with financing converting at higher AOV?
Does engaging with UGC increase purchase likelihood?
Are bundle-builder shoppers more profitable?
Instead of guessing which micro-interactions signal buying intent, you can measure them directly.
This moves optimization from assumption to precision.
You’re no longer tracking traffic.
You’re tracking intent.
(We’ll explore Custom Events in depth in an upcoming release.)

Pop-Up Surveys: Connect Behavior with Motivation
Clicks show behavior.
Pop-Up Surveys reveal motivation.
Ask contextual questions during the shopping experience and tie responses directly to real behavioral data, so you understand not just what shoppers did, but why they did it.
In real time, you can uncover:
- What nearly stopped a purchase
- What information felt missing
- What created hesitation
- What convinced customers to move forward
Instead of relying solely on quantitative patterns, you gain qualitative clarity, attached to the exact session, page, and journey.
This transforms optimization.
You’re no longer guessing at friction. You’re hearing it directly from customers.
And when behavioral data and customer motivation align, decisions get sharper.
That’s where meaningful revenue growth happens.
(We’ll explore Pop-Up Surveys in more depth in an upcoming release.)
Built for the Next Phase of Optimization
This evolution isn’t about adding features.
It’s about upgrading how optimization happens inside Heatmap.
Faster insight.
Clearer signals.
Less friction between data and action.
Instead of juggling tools and disconnected reports, everything now connects:
- Revenue data
- Behavioral journeys
- Custom event tracking
- Qualitative feedback
- AI-generated summaries
- Team collaboration
All in one system.
Most analytics tools show activity.
Heatmap connects behavior to revenue and makes it easier to act on what matters.
That’s the real upgrade.
Less time digging.
More time improving Revenue Per Session.
More confidence in every decision.
This isn’t a cosmetic redesign.
It’s a smarter, more connected version of the platform, built to support continuous optimization, not one-off analysis.
And we’re just getting started.
Over the coming weeks, we’ll go deeper into Journey Analysis, Custom Events, and Pop-Up Surveys.
👉 Log in and explore the new experience
Your website just got easier to optimize.
And smarter.
How You Can Do It:
1: Download heatmap
2: Wait for 5k sessions
3: Reorganize products based on the highest revenue per session from top left to bottom right.

Founder of heatmap, SplitTesting.com, and multiple ecommerce brands. Lifelong optimizer, CRO-lover, and data nerd.


You made it all the way down here?
Might as well give us a shot, right? It'll change the way you approach CRO. We promise. In fact, our friend Nate over at Original Grain used element-level revenue data from heatmap to identify high-impact areas of his website to test, resulting in a 17% lift in Revenue per Session while scaling site traffic by 43%. Be like Nate. Try heatmap today.
